Statistical methods
The Statistical methods menu includes functionalities for modelling, analysis and the seasonal adjustment of a time series. They are divided into three groups:
- Anomaly Detection – allows for a purely automatic identification of regression effects;
- Modelling – enables time series modelling using the TRAMO and RegARIMA models;
- Seasonal adjustment – intended for the seasonal adjustment of a time series with the TRAMO-SEATS and X-13ARIMA-SEATS methods.
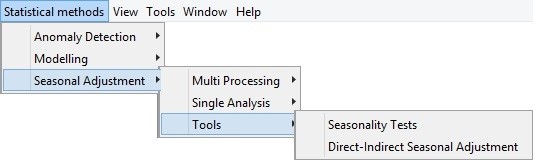
The Statistical methods menu.
Anomaly Detection
The primary goal of the functionalities that are available in the Anomaly Detection section is the identification of atypical values called outliers. According to the ‘ESS Guidelines on Seasonal Adjustment’ (2015), seasonal adjustment methods are likely to be severely affected by the presence of such values; therefore they should be detected and replaced simultaneously or before estimating the seasonal and calendar components in order to avoid a distorted or biased estimation.
The use of the RegARIMA models is recommended by the ‘ESS Guidelines on Seasonal Adjustment’ (2015) to estimate and remove outliers before estimating the seasonal effect. As the presence of outliers could greatly affect the quality of the decomposition, the various types of outlier (i.e. additive outliers, transitory changes, level shifts, etc.) should be detected and corrected for.
This element of quality control should be performed each time new or revised data become available. Manual inspection of the data is problematic, especially in the case of large datasets. Also, it usually relies on some simple measures, which do not consider the full information contained in the series, but just a few values. Therefore the results of the manual inspection can be severaly affected by seasonality, noise, or special events.
JDemetra+ includes two tools dedicated to the automatic identification of outliers: Check Last and Outliers Detection. Both are based on the TERROR program, which is an application from TRAMO. TERROR is executed by both tools to automatically (with several available options) detect outliers.
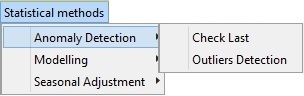
The Anomaly detection menu.
Check Last
The Check Last tool automatically detects using the TRAMO model forecasts up to three last observations and marks the observations that are too different from their forecasted values. The Check Last Batch window is divided into three panels. The panel on the left presents the list of the analysed series. The results are dispalyed in the panels on the right.
To launch the analysis, drag and drop a series from the Providers window into the left hand side panel of the Check Last Batch window and click the Start button (denoted with the green arrow) from the menu in the top part of the window. The analysis will be performed using the TRAMO specification selected from the list. By default, TR4 is used.
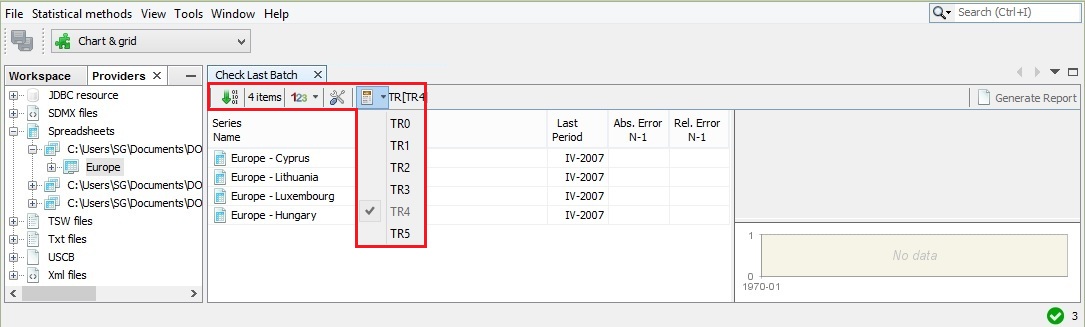
The Check Last initial window with series to be processed and the list of available specifications expanded.
JDemetra+ removes the last observations from the series and calculates a one-period-ahead out-of-sample forecast of the series. The forercasted values are then compared with the actual values. The user may decide how many of the last observations will be considered (one, two, or three) in this procedure (click on the 123 button and specify the number). The number of columns visible in the panel on the left will be adjusted accordingly to the user’s choice.
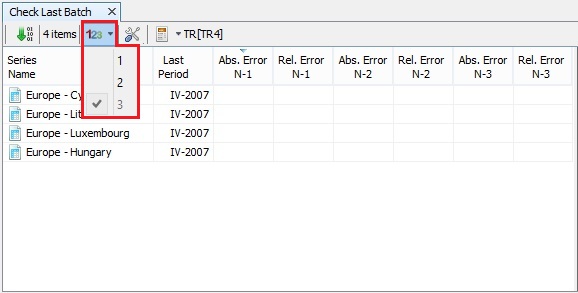
The options for number of observations to be examined.
The default settings can be changed in the Properties dialog box (the number of last observations that will be compared to the forecasted values, specification used for modelling and the threshold values used to decide if observations are abnormal). To open it, click on the button marked with the working tools.
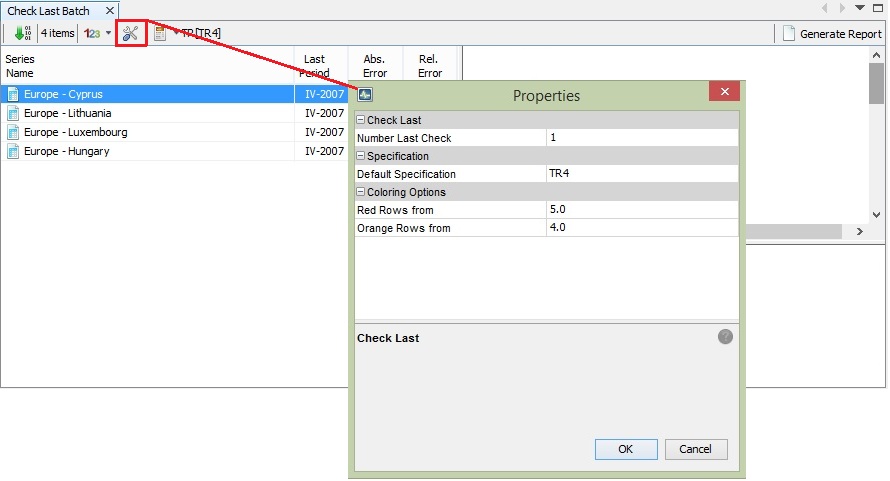
The properties for the Check Last functionality.
Once the process is executed, click on the series on the list to display the results. For each series the program automatically identifies an ARIMA model, detects several types of outliers, interpolates missing values and estimates the calendar effects, if appropriate. Study the detailed results section using the vertical scrollbar.
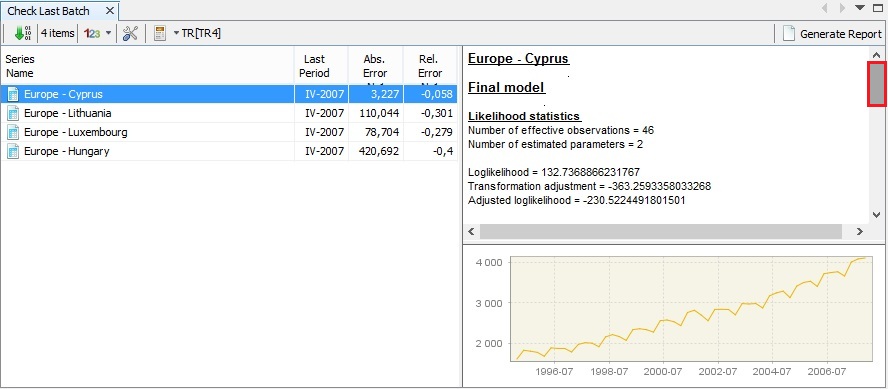
The results of the outlier’s detection process.
The last observations (one, two or three, depending of the user’s choice) are compared with the forecasted values. If, for a given observation, the forecast error divided by a standard deviation of residuals is greater than the first threshold value and lower than the second threshold value, then this observation is classified as containing a “possible error” and marked in orange. If this value is greater than the second threshold value, then the new observation is classified as containing a “likely error” and marked in red. Otherwise, the observation is accepted as “without an error”1.
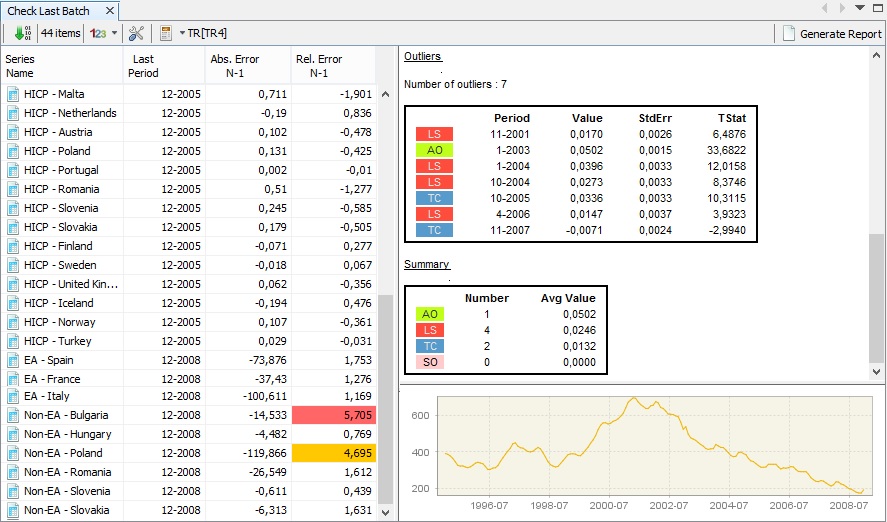
Investigation of the outliers’ detection results.
JDemetra+ enables the user to save the results of this analysis in the compact form of a report. To generate it, click on the Generate Report button and specify the sorting options.
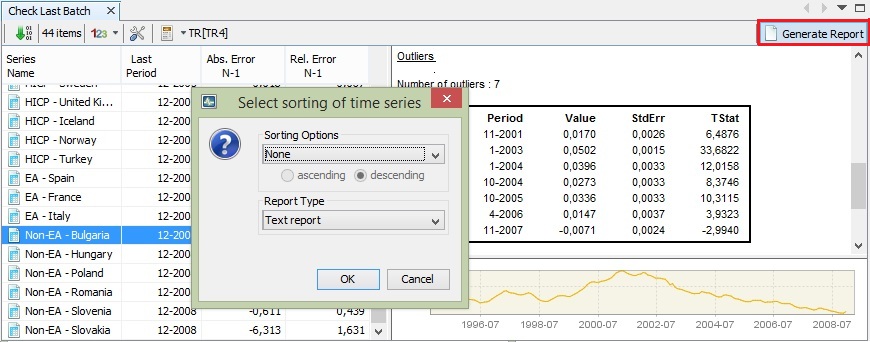
The Generate Report functionality.
To save the report click OK and select a destination folder.
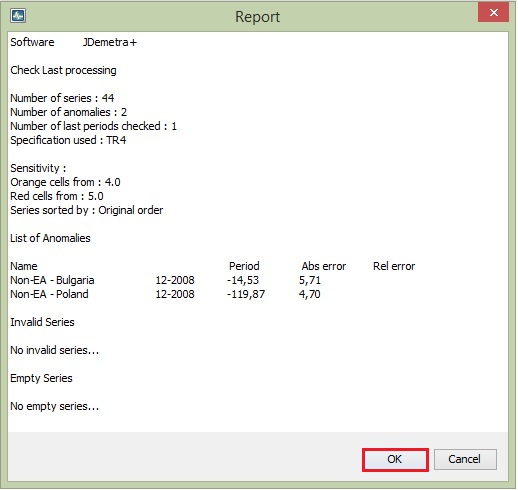
Report from the outliers’ detection process.
Outlier detection
The Outlier Detection tool allows for the identification of an ARIMA model, including the detection of outliers, interpolation of missing values and the estimation of any calendar effects. A step-by-step demonstration of the Outlier Detection tool capabilities and options can be found here.
Modelling
The aim of the Modelling section is to provide tools for time series modelling and forecasting without performing the estimation of its components and decomposition. The estimated results can be useful for time series analysis and in the prediction of short-term developments.
The Modelling section includes all capabilities from the TRAMO and RegARIMA models. It is flexible in specifying model parameters. The results can be saved and refreshed with updated series. Instructions on how to use this functionality is given in the step-by-step demonstration on advanced time series analysis.
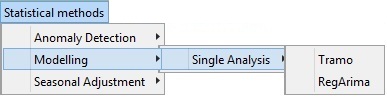
The Modelling menu.
Seasonal Adjustment
The Seasonal Adjustment section provides tools to perform seasonal adjustment for a single time series as well as for multiple time series using the TRAMO-SEATS or X-13ARIMA-SEATS methods. It also offers several seasonality tests that can be used to scrutinize the presence and the nature of seasonal movements in a time series independently from the seasonal adjustment. Finally, the Direct-Indirect Seasonal Adjustment tool enables a comparison of the results from direct and indirect seasonal adjustment performed on the aggregated series.
The guidance for using these functionalities is given in the Case studies section:
- basic scenario detailing the use of automatic modelling in seasonal adjustment;
- different types of user interventions;
- Seasonality Tests;
- Direct-Indirect Seasonal Adjustment.
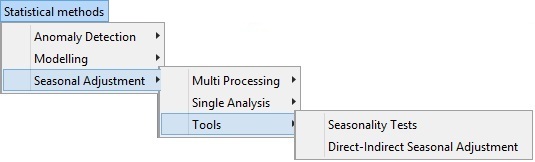
The Seasonal Adjustment menu.
-
CAPORELLO, G., and MARAVALL, A. (2004a) ↩