Seasonality tests
Seasonality tests play a fundamental role at different stages of the automatic model identification process used by TRAMO-SEATS. They are also crucial in the assessment of the results produced by X-13-ARIMA-SEATS. When X-13-ARIMA-SEATS is used, the seasonal component is estimated regardless of the properties of the original time series. Therefore the user is expected to decide if seasonality is (or is not) present in the time series.
The scenario presented here helps to identify seasonal movements in the original time series using various tests available in JDemetra+. Its purpose is to check for the presence of seasonal movements in the time series and decide whether it should be adjusted for them or not. Some explanations on the seasonality tests can be found here.
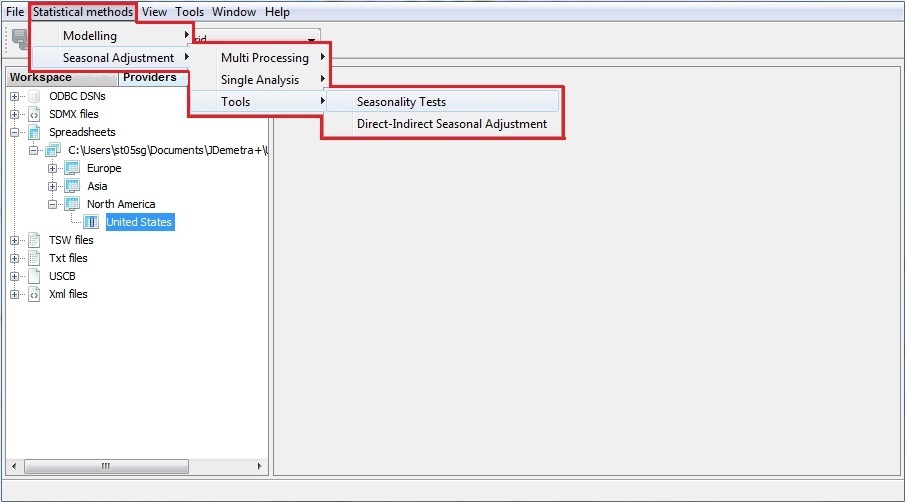
Go to the main menu and follow the path: Statistical methods → Seasonal Adjustment → Tools → Seasonality tests.
Opening a Seasonality test window
-
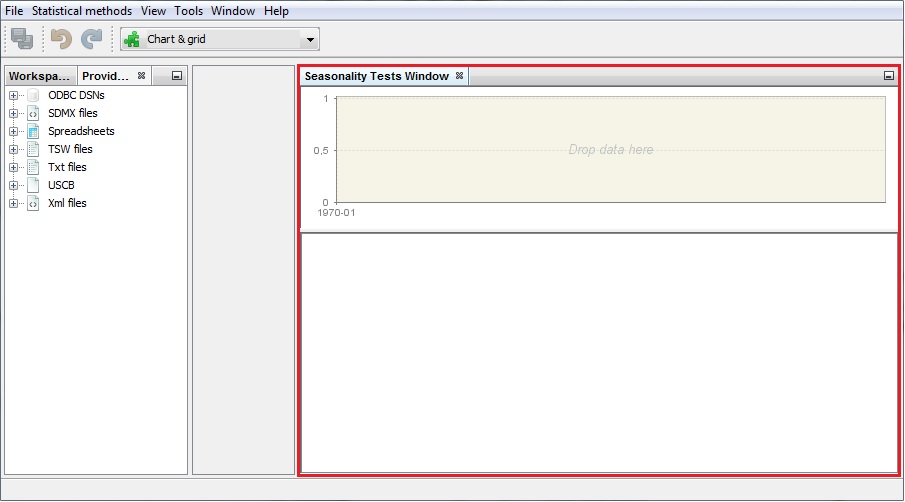
JDemetra+ opens a Seasonality tests window. It contains two empty panels. Once an analysis of a time series has been performed, the upper one will show a time series graph and the lower one will present detailed results for seasonality tests.
The Seasonality Tests window
-
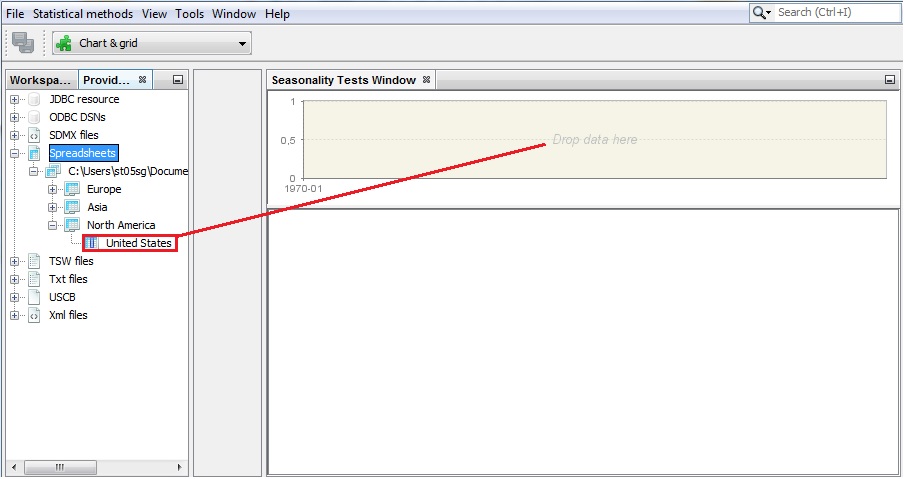
To start the analysis, drag and drop one time series from the Providers window to the Drop data here area as shown below.
Launching the functionality
-
The testing process starts automatically. The upper panel displays a time series graph of the unadjusted data. Hovering over an observation with the mouse displays its value and date.
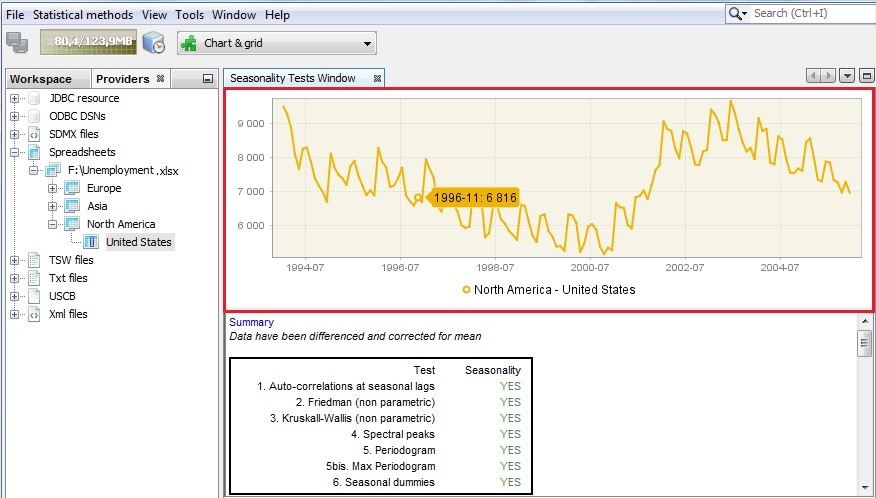
Time series graph
-
Using the local menu the user may adjust the view of the picture, save it and/or save it to a set location (for details see 2.1.3).
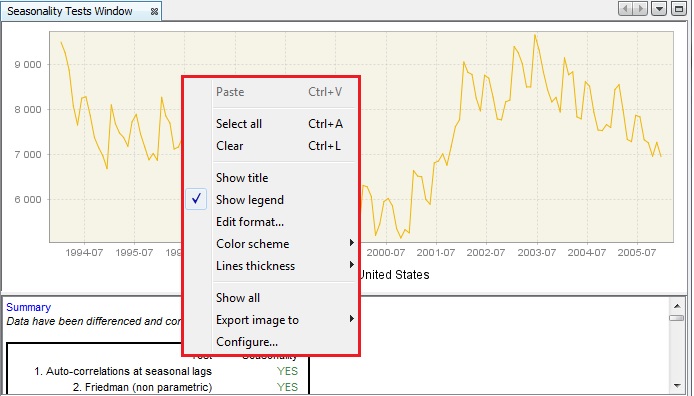
Local menu basic options for the time series graph
-
By going to the main menu and choosing a path Window → Properties, one can re-run the tests with the alternative data transformations (logging and/or differencing) and a different sample size (option last years). When the option Last years is set to zero, the tests will be executed using all available observations. Be aware that the properties window displays the properties of an active item. Therefore, click on the time series graph in the picture below to display the properties correctly.
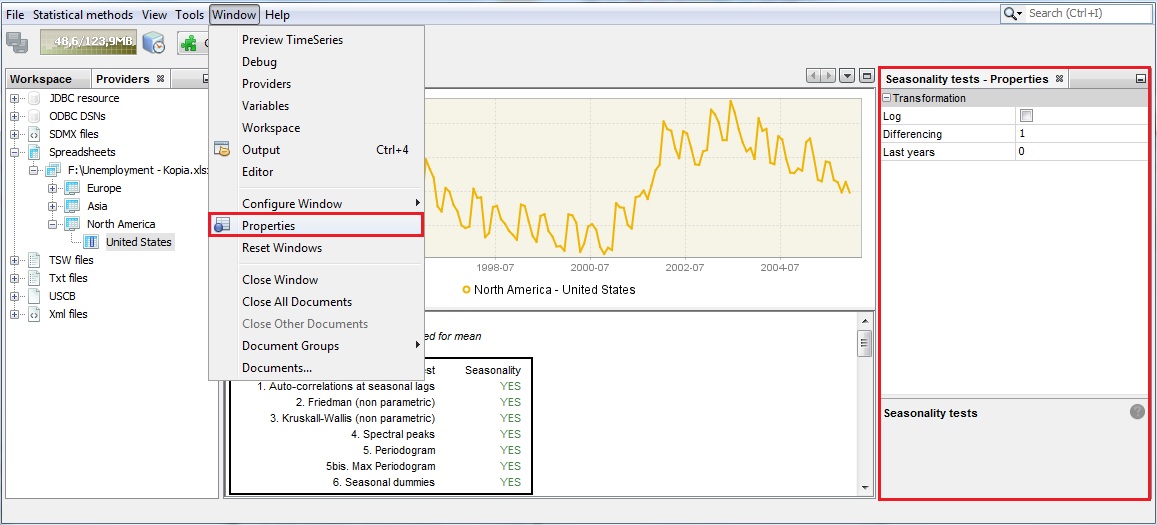
Seasonality tests options
-
The diagnostic section in the bottom part of the window contains a summary table and detailed results for six seasonality tests. Study this section using the vertical scrollbar. The results are marked in green, yellow or red, depending on the result of statistical test used. In general, an outcome that appears in JDemetra+ interface in green indicates no evidence of a problem in a tested area, yellow is uncertain and red indicates an issue that should be addressed. In this scenario the results in green indicate that the given test detected seasonal movements. For tests where p-values are given, green denotes that the desired test result was achieved at the 5% confidence level. An outcome in yellow means that the relevant test statistics can be accepted at the 1% level. An outcome in red denotes that the hypothesis of the desired outcome was rejected.
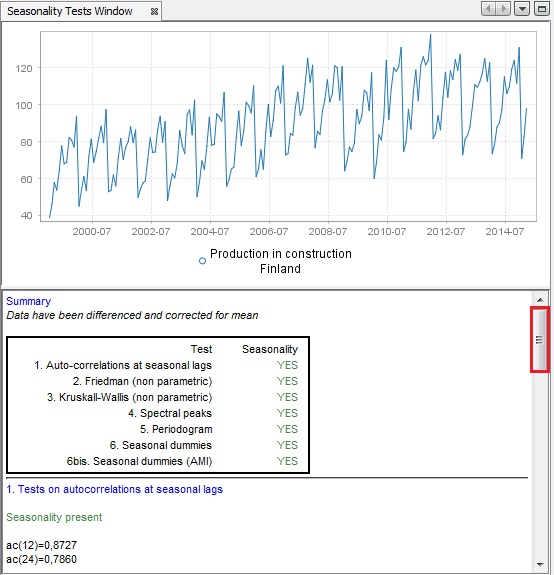
Seasonality tests results section
-
The test on autocorrelation on seasonal lags is the Ljung-Box test. It checks the correlation between the actual observation and observation lagged by one and two years. In the case of a monthly time series the autocorrelation between these values is denoted as ac(12) and ac(24) respectively. In case of a quarterly time series the autocorrelation between these values is denoted as ac(4) and ac(8) respectively. If the observations are independent from each other, they follow a $\chi^{2}$ distribution. When this hypothesis is rejected, a significant autocorrelation is confirmed, which is a sign of seasonal movements in the series and the test’s outcome is displayed in green.
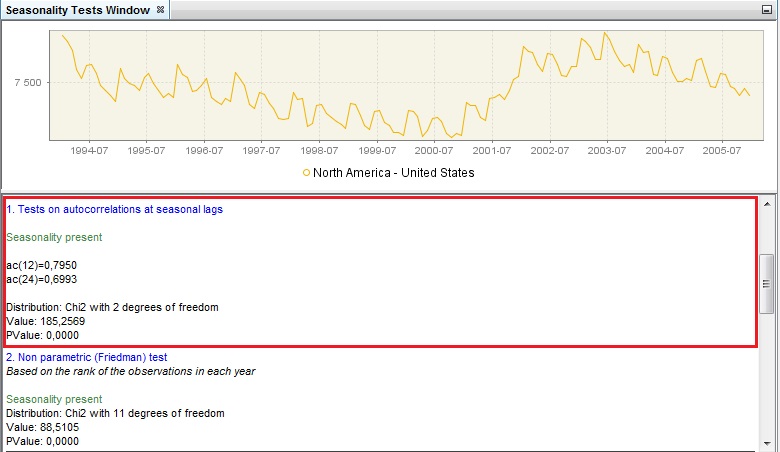
Test on autocorrelations at seasonal lags
-
The Friedman test is a non-parametric method for testing that samples are drawn from the same population or from populations with equal medians. In the regression equation the significance of the month (or quarter) effect is tested. The Friedman test requires no distributional assumptions. It uses the rankings of the observations. If the null hypothesis of no stable seasonality is rejected at the 0.1% significance level, $p Value < 0.001$, then the series is considered to be seasonal and the test’s outcome is displayed in green.
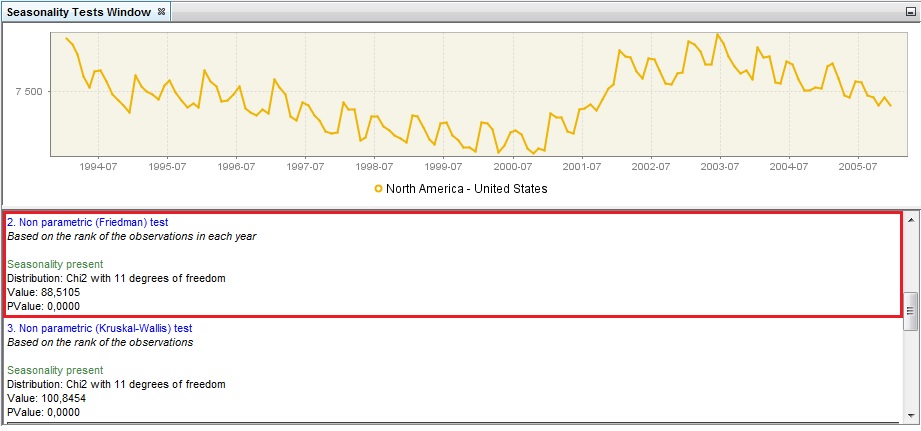
Non-parametric Friedman test
-
The Kruskal-Wallis test is a non-parametric test used for comparing samples from two or more groups. The null hypothesis states that all months (or quarters, respectively) have the same mean. Under this hypothesis the test statistic follows a $\chi^{2}\ $distribution. When this hypothesis is rejected, it is assumed that time series values differ significantly between periods and the test’s results are displayed in green.
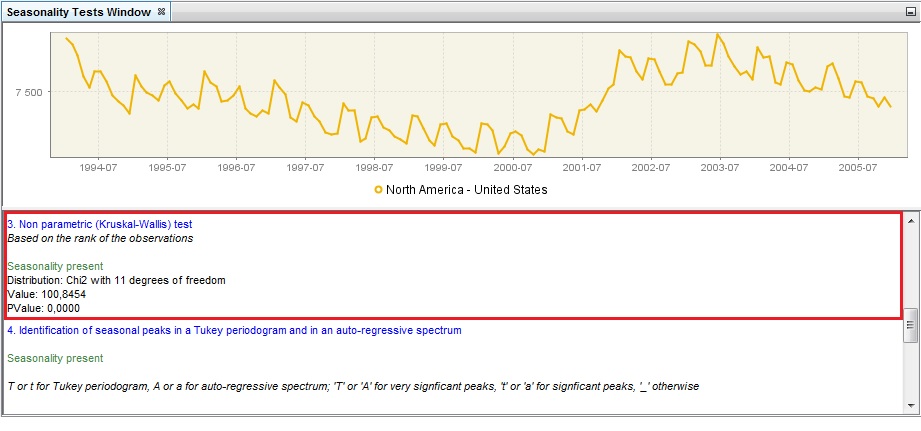
Non-parametric Kruskal-Wallis test
-
The identification of seasonal peaks can also be carried out with the auto-regressive spectrum and Tukey periodogram. The autoregressive spectrum is based on the estimation of an AR(30) process, while the Tukey periodogram is a non-parametric estimator that introduces some degree of smoothing in the periodogram. In order to decide whether the series has a seasonal component that is predictable (stable) enough the tests use visual criteria and formal tests that rely on two basic principles: a) the peaks associated to seasonal frequencies should be larger than the median spectrum for all frequencies and b) the peaks should exceed the spectrum of the two adjacent values by more than a critical value. When these principes are met, the test results are displayed in green. The statistical significance of each one of the seasonal peaks (i.e. frequencies $\frac{\pi}{6},\ \frac{\pi}{3},\ \frac{\pi}{2},\ \frac{2\pi}{3},\ \frac{5\pi}{6}\text{ }$and $\pi$ corresponding to 1, 2, 3, 4, 5 and 6 cycles per year) are also displayed.
-
The auto-regressive spectrum test is a test that originates from the X-13ARIMA-SEATS program. It is based on the spectral density (spectrum) function, which reformulates the content of the stationary time series’ autocovariances in terms of amplitudes at frequencies of half a cycle per month or less. Due to the possibly evolving nature of the seasonal movements the interval for spectrum estimation is the 96 most recent observations. The test checks if the series has a seasonal component that is predictable (stable) enough so that X-13ARIMA-SEATS can estimate it with reasonable success. When such a case is detected, the test’s result is displayed in green. This test is available only for monthly data. In case of quarterly time series it is not displayed.
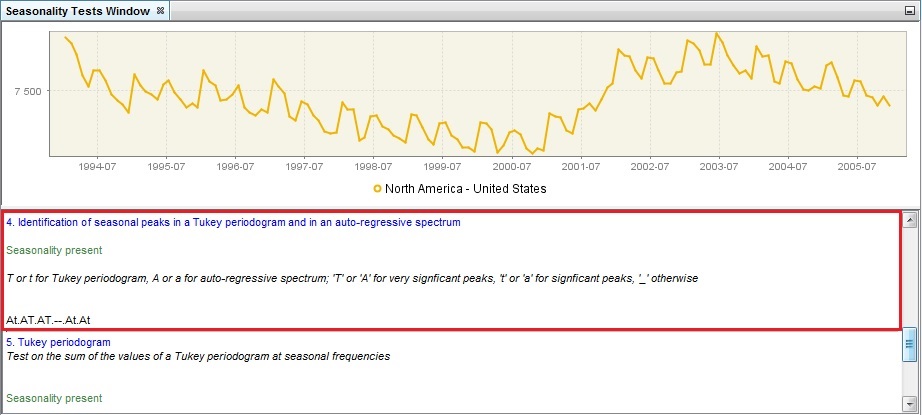
Identification of seasonal peaks in a Tukey periodogram and in an auto-regressive spectrum
-
As opposed to the empirical criteria described in the previous point, one can use a formal test to assess the statistical significance of the periodogram’s peaks at seasonal frequencies. The test proposed is based on the sum of the values of the periodogram at seasonal frequencies, which follows a $\chi^{2}$(24) distribution under the null hypothesis of an absence of seasonality.
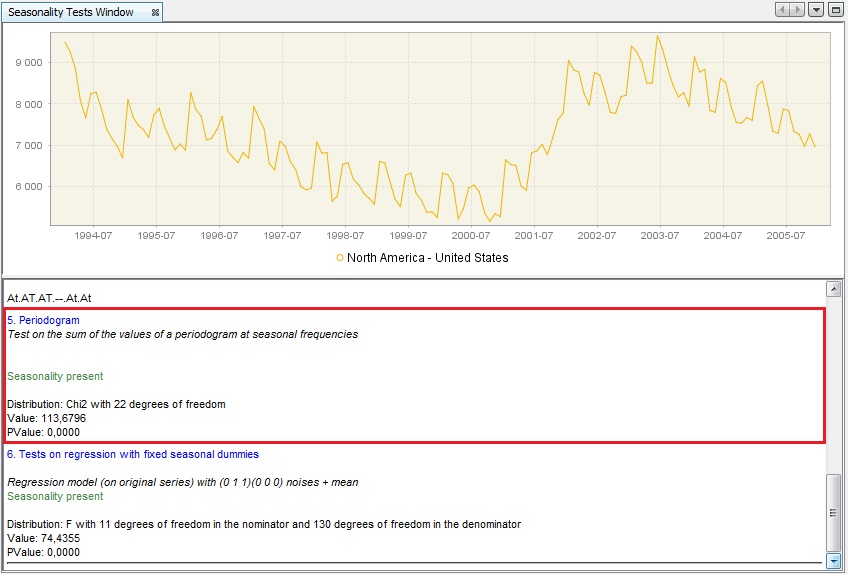
A periodogram
-
Finally, a test on a regression with seasonal dummies checks the presence of deterministic seasonality. The first version of the test uses seasonal dummies (mean effect and 11 dummies for monthly data, or 3 dummies for quarterly data) in a RegARIMA model, in which the ARIMA part of the model is (0,1,1)(0,0,0). The test statistics checks if the seasonal dummies are jointly statistically insignificant. When this hypothesis is rejected, it is assumed that the deterministic seasonality is present and the test’s results are displayed in green.
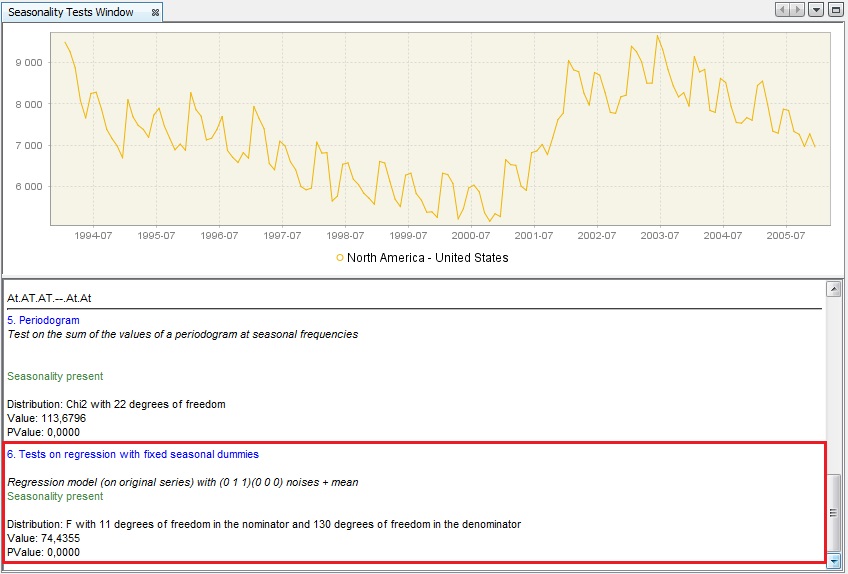
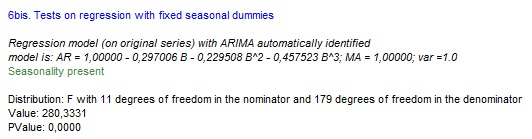
Tests on regression with the fixed seasonal dummies
-
In the second version of this test the regression is performed on an automatically identified ARIMA model instead of ARIMA (0,1,1)(0,0,0). The test statistics checks if the seasonal dummies are jointly statistically insignificant. When this hypothesis is rejected, it is assumed that deterministic seasonality is present and the test’s results are displayed in green.