General information
The default JDemetra+ window, which is displayed after launching the program, is clearly divided into several panels.
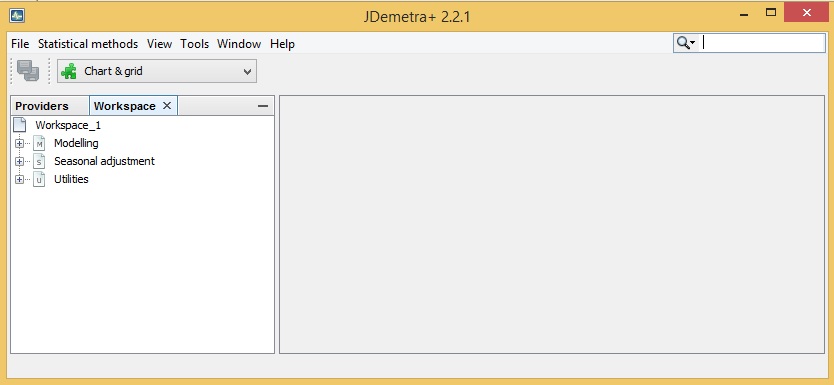
JDemetra+ default view
The key parts of the user interface are:
- The application menu.
- The Providers window, which organises time series;
- The Workspace window, which stores results generated by the software as well as settings used to create them;
- A central empty zone for presenting the actual analyses further called the Results panel.
Application menu
The majority of functionalities are available from the main application menu, which is situated at the very top of the main window. If the user moves the cursor to an entry in the main menu and clicks on the left mouse button, a drop-down menu will appear. Clicking on an entry in the drop-down menu selects the highlighted item.
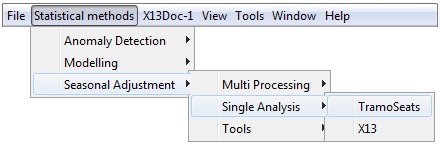
The main menu with selected drop-down menu
The functions available in the main application menu are:
Results panel
The blank zone in the figure above (on the right of the view) is the location where JDemetra+ displays various windows. More than one window can be displayed at the same time. Windows can overlap with each other with the foremost window being the one in focus or active. The active window has a darkened title bar. The windows in the results panel can be arranged in many different ways, depending on the user’s needs. The example below shows one of the possible views of this panel. The results of the user’s analysis are displayed in an accompanying window. The picture below shows two panels – a window containing seasonal adjustment results (upper panel) and another one containing an autoregressive spectrum (lower panel).
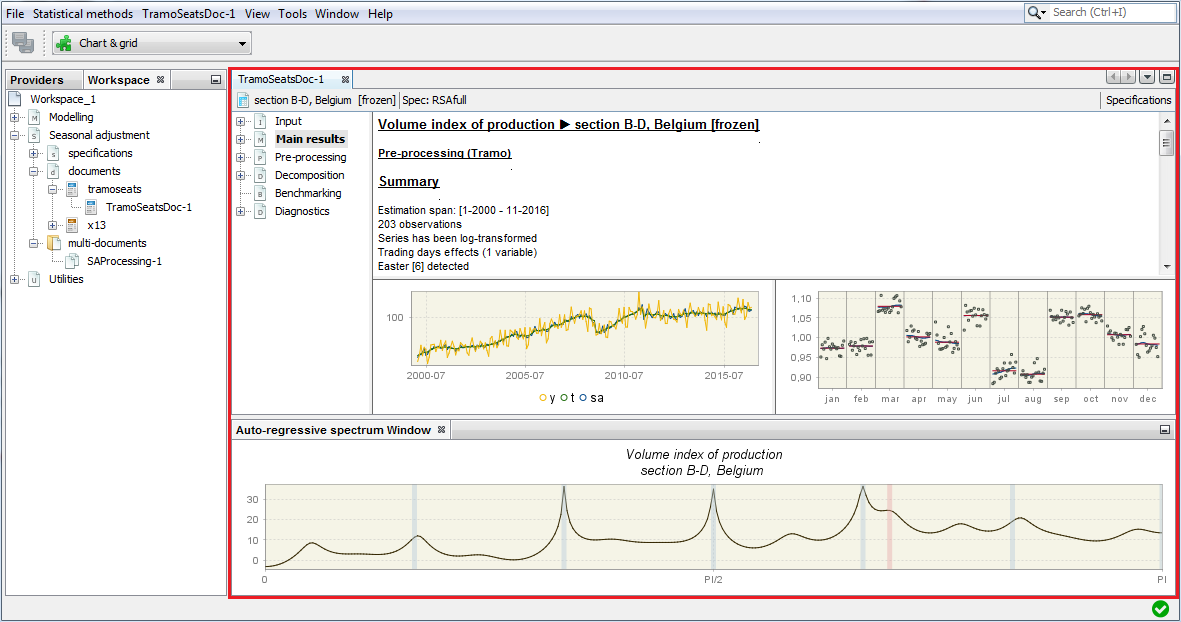
The Results panel filled with two windows