Data visualization
-
To display a given series, right click on it and choose the Chart & grid option from the local menu. The graph is displayed in the panel on the right.
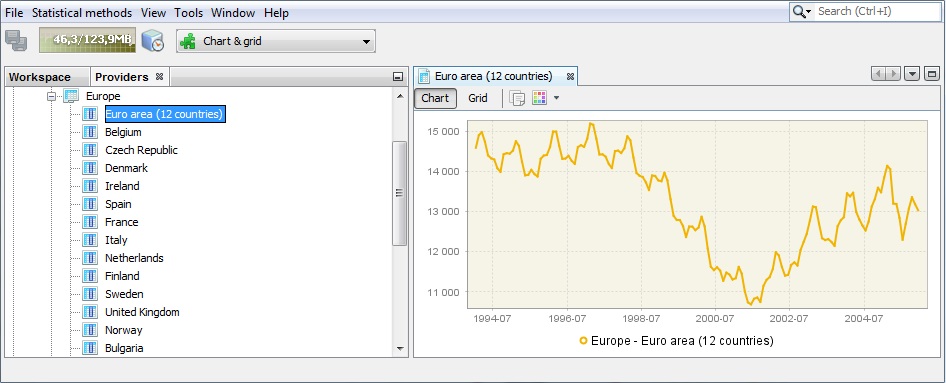
Time series graph
-
Using the local menu that is available for the chart the user may adjust the view of the picture, save it and/or save it in a given location.
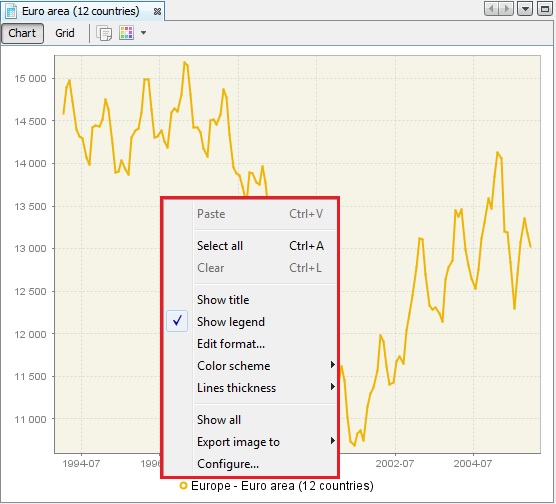
Local menu basic options for the time series graph
-
Once the time series is marked by clicking on it with the left mouse button, more sophisticated options are available, in addition to the standard ones shown above.
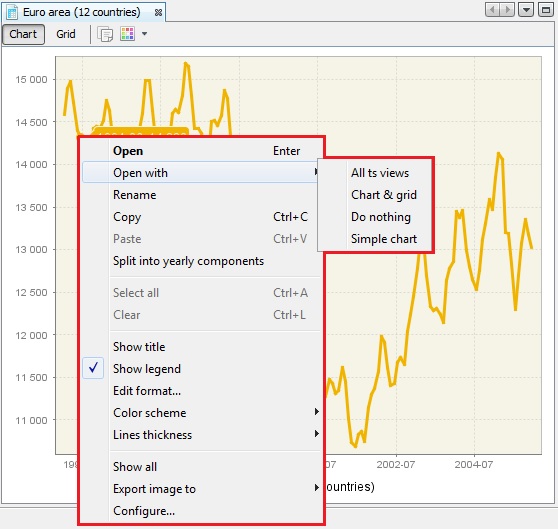
Full local menu options
-
These additional options include the Open with option, which opens time series in a separate window according to the user choice (chart & grid or only chart). All ts views option is not available at the moment. The picture below shows the view displayed once Chart & grid option was chosen. By clicking on the marked buttons the user can switch between chart and grid view. For both views (chart and grid) the local menu is available.
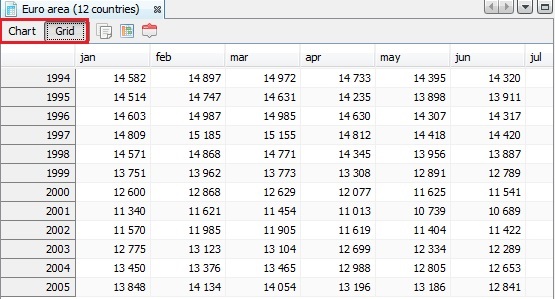
Chart & grid view
-
Rename option (see below) enables the user to change the time series name.
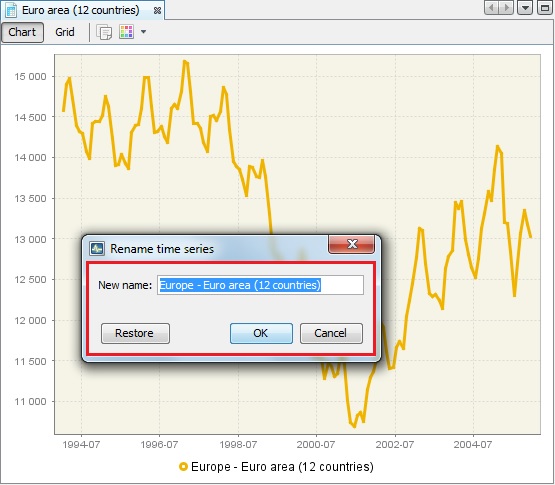
Renaming a time series
-
The option Split into the yearly components opens an additional window that presents the analysed series data split by year. This chart is useful to investigate the differences in time series values caused by the seasonal factors. The graph gives some idea about the existence and size of deterministic and stochastic seasonality in data.
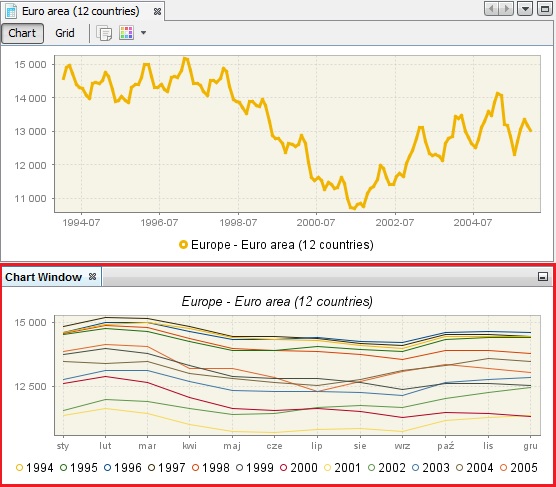
Split into the yearly components option’s result
-
To display more than one series on the graph, select Tools → Container → Chart from the main menu. Next, drag a drop series to the Chart window.
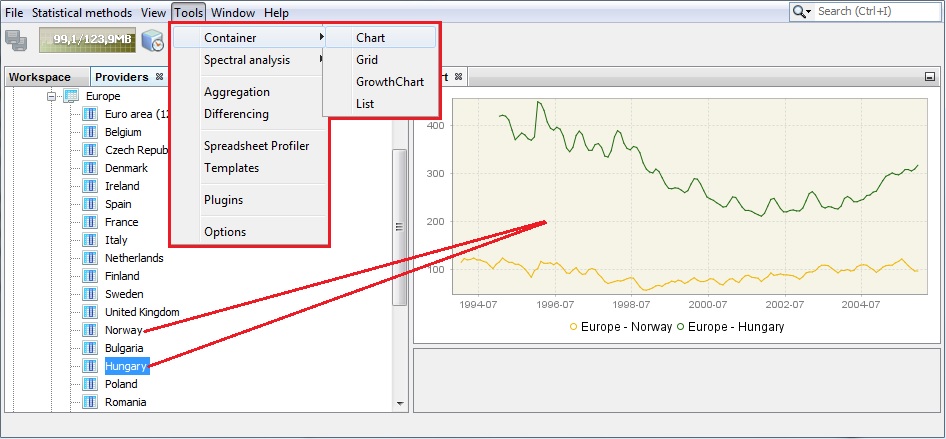
Chart window