Input series and settings
The Input section includes the original series and the settings used to generate the output presented in the Model section.
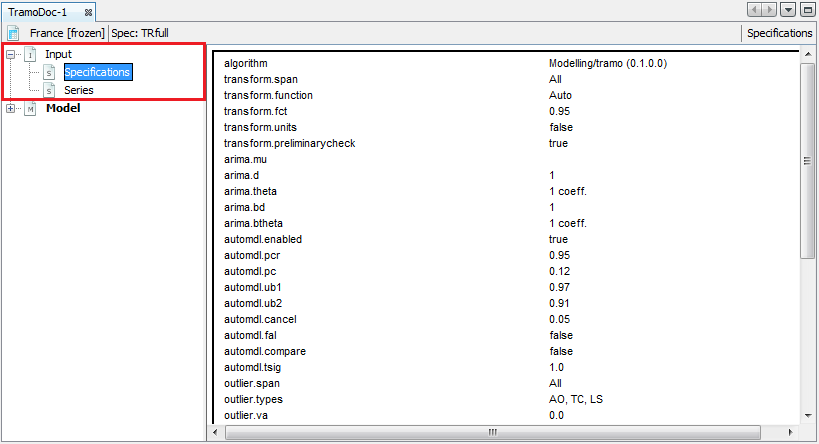
The view of the Specification panel
The original series are presented as a table in the Series node. To display the local menu, point any value in the table and right click.
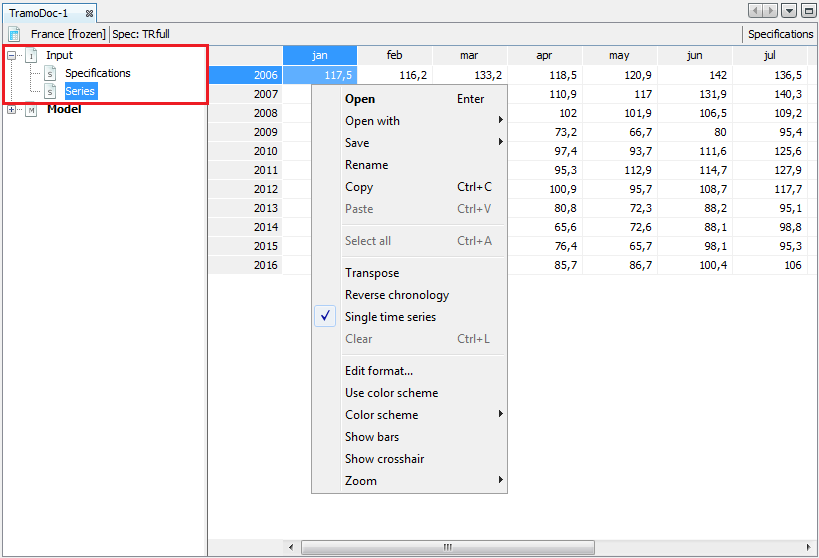
The local menu for the Series view
The table can be copied to Excel by dragging and dropping the top left corner cell to an Excel sheet. A standard local menu provides a list of available actions:
-
Open – opens a window presenting time series as a graph and as a table.
-
Open with – opens the time series in a separate window according to the user choice (chart & grid or only chart). The All ts views option is not currently available.
-
Save – saves a table as a spreadsheet file or a text file.
-
Rename – enables the user to change the time series name.
-
Copy – copies series and allows it to be pasted to the another application e.g. into Excel.
-
Transpose – changes the orientation of the table from horizontal to vertical.
-
Reverse chronology – displays the series from last to first observation.
-
Single time series – when it is marked observations are divided by calendar’s periods. Otherwise, data are presented as a standard time series.
-
Edit format – allows the format used for displaying dates and values to be changed.
-
Use color scheme – allows series values to be displayed in a chosen color.
-
Color scheme – allows for a choice of color scheme from a pre-specified list.
-
Show bars – presents a values in a table as horizontal bars.
-
Show crosshair – highlights an active cell.
-
Zoom – an option for modifying the chart size.
Paste, Select all and Clear are disabled as they are not relevant for this view.