Likelihood
The Likelihood panel gives some insights into the results of the estimation of the log-likelihood function. The chart represents the opposite of the log-likelihood function. The maximum log-likelihood is denoted by a red dot. The graph allows the user to study the parameters of the ARIMA model estimated in the optimization procedure. As the graph is three-dimensional, the graph is plotted for two chosen parameters. The user can modify this choice with the options available on the right. The menu offers additional options for adjusting a view.
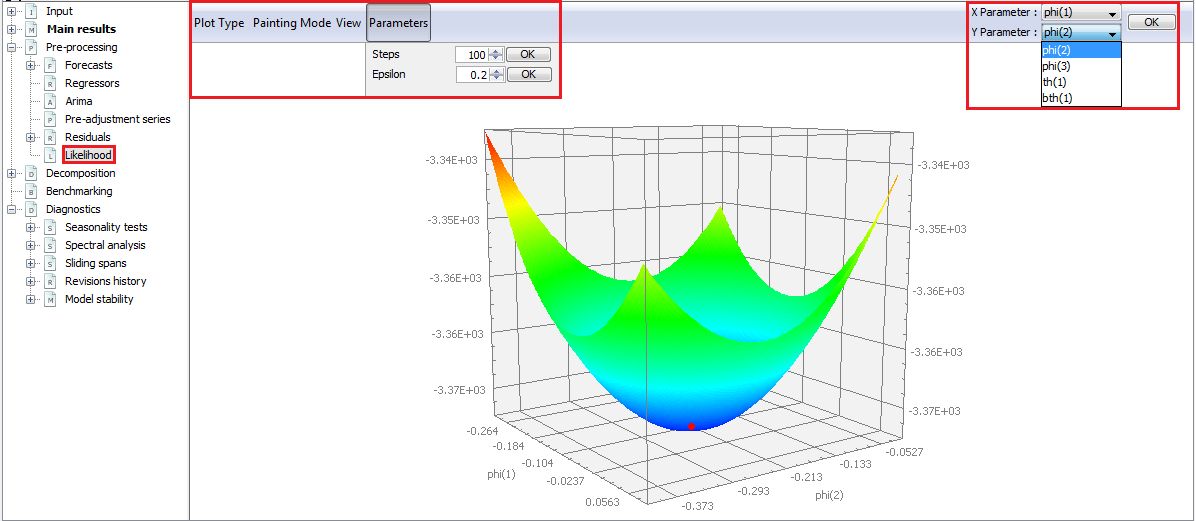
The example of the content of the Likelihood panel
The settings for computation of the log-likelihood function can be modified through the Parameters menu. The Steps parameter is the number of values used for each parameter. The Epsilon parameter defines the range used in the estimation of the parameter. In other words, the likelihood function is computed, for each coefficient \(c_{i}\) in the range \(\lbrack c_{i}\left( \max \right) - \text{epsilon};c_{i}\left( \max \right) + \text{epsilon}\rbrack\), for values separated by \(\frac{(2 \times \text{epsilon})}{(\text{steps} - 1)}\). The value \(c_{i}\left( \max \right)\ \)is the value of the coefficient corresponding to the maximum likelihood.