Data providers
The Providers window presents the list of the data sources and organises the imported series within each data provider.
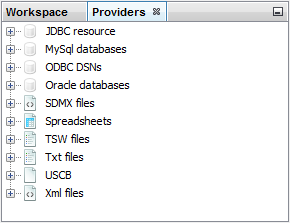
The Providers window
The allowed data sources include:
- JDBC;
- ODBC;
- SDMX;
- Spreadsheets;
- TSW;
- TXT;
- USCB;
- XML.
All standard databases (Oracle, SQLServer, DB2, MySQL) are supported by JDemetra+ via JDBC, which is a generic interface to many relational databases. Other providers can be added by users by creating plugins (see Plugins section in the Tools menu). To import data, right-click on the appropriate provider from the Providers panel and specify the required parameters. For all providers the procedure follows the same logic. An example is provided here.
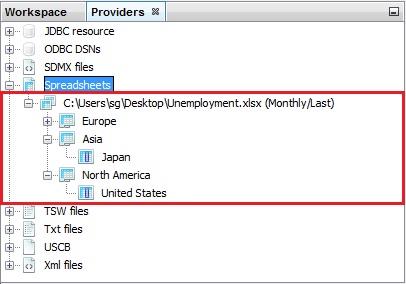
The Providers window organises data in a tree structure reflecting the manner in which data are presented in the original source. The picture below presents how JDemetra+ visualises the imported spreadsheet file. If the user expands all the pluses under the spreadsheet all the series within each sheet that has been loaded are visible. Here two time series are visible: Japan (under the Asia branch) and United States (under the North America branch) while the Europe branch is still folded. The names of the time series have been taken from the column headings of the spreadsheet while the names of the branches come from sheets’ names.

A structure of a dataset
Series uploaded to the Providers window can be displayed, modified and tested for seasonality and used in estimation routines (see Modelling and Seasonal adjustment). The data sources can be restored after re-starting the application so that there is no need to get them again. This functionality can be set in the Behaviour tab available at the Option item from the Tools menu.
Spreadsheets
The Spreadsheets data source corresponds to the series prepared in the Excel file. The file should have true dates in the first column (or in the first row) and titles of the series in the corresponding cell of the first row (or in the first column). The top-left cell [A1] can include a text or it can be left empty. The empty cells are interpreted by JDemetra+ as missing values and they can appear in the beginning, in the middle and in the end of time series.
An example is presented below:
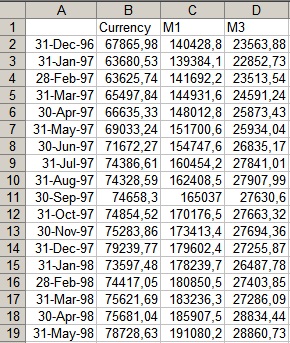
Example of an Excel spreadsheet that can be imported to JDemetra+
Time series are identified by their names. JDemetra+ derives some information (like data periodicity, starting and ending period) directly from the first column (or from the first row, depending on the chosen data orientation (vertical or horizontal)).
Import data
To import data from a given data source, click on this data source in the Providers window shown below, choose Open option and specify the import details, such as a path to a data file. These details vary according to data providers. The example below show how to import the data from an Excel file.
-
From the Providers window right-click on the Spreadsheets branch and choose Open option.
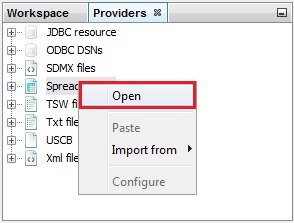
Data provider available by default
-
The Open data source window contains the following options:
-
Spreadsheet file – a path to access the Excel file.
-
Data format – the data format used to read dates and values. It includes three fields: locale (country), date pattern (data format, e.g. yyyy-mm-dd), number pattern (a metaformat of numeric value, e.g. 0.## represents two digit number).
-
Frequency – time series frequency. This can be undefined, yearly, half-yearly, four-monthly, quarterly, bi-monthly, or monthly. When the frequency is set to undefined, JDemetra+ determines the time series frequency by analysing the sequence of dates in the file.
-
Aggregation type – the type of aggregation (over time for each time series in the dataset) for the imported time series. This can be None, Sum, Average, First, Last, Min or Max. The aggregation can be performed only if the frequency parameter is specified. For example, when frequency is set to Quarterly and aggregation type is set to Average, a monthly time series is transformed to quarterly one with values that are equal to the one third of the sum of the monthly values that belong to the corresponding calendar quarter.
-
Clean missing – erases the missing values of the series.
Next, in the Source section click the grey “….” button (see below) to open the file.
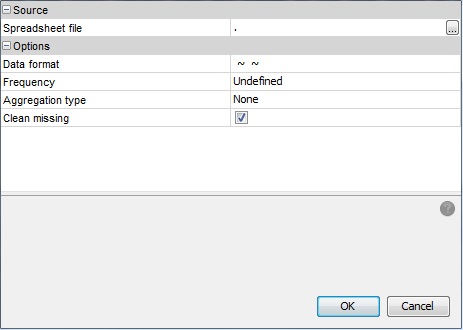
Data source window
-
-
Choose a file and click OK.
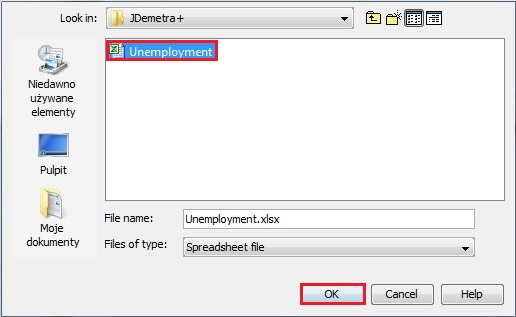
Choice of an Excel spreadsheet
-
The user may specify Data format, Frequency and Aggregation type, however this step is not compulsory. When these options are specified JDemetra+ is able to convert the time series frequency. Otherwise, the functionality that enables the time series frequency to be converted will not be available.
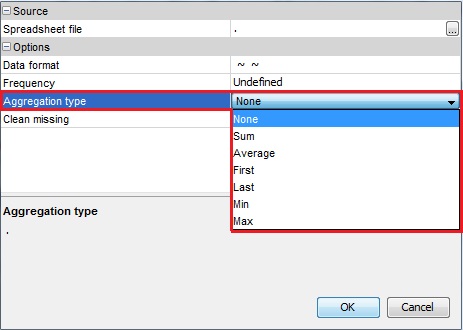
Options for importing data
-
The data are organized in a tree structure.
Dataset structure
Once the data has been successfully imported, it is available to the user for various analyses (e.g. visualization, modelling, seasonal adjustment, etc.)