Simple seasonal adjustment of multiple time series
This scenario describes the seasonal adjustment of a dataset with multiple time series. It is especially useful when hundreds of series need to be processed and the quality of their adjustment assessed. This scenario can be used in a regular production process. As it does not focus on individual series, it is not recommended for the adjustment of key indicators that requires a detailed analysis of the results and possible refining of the seasonal adjustment settings. The scenario shows the steps of the data generating process for multiple series, with references to the appropriate sections of the Reference Manual for more detailed explanations. Although this case study is intended for datasets with multiple time series, it can be also performed for a single time series, provided that the analysis is done in a multi-document.
-
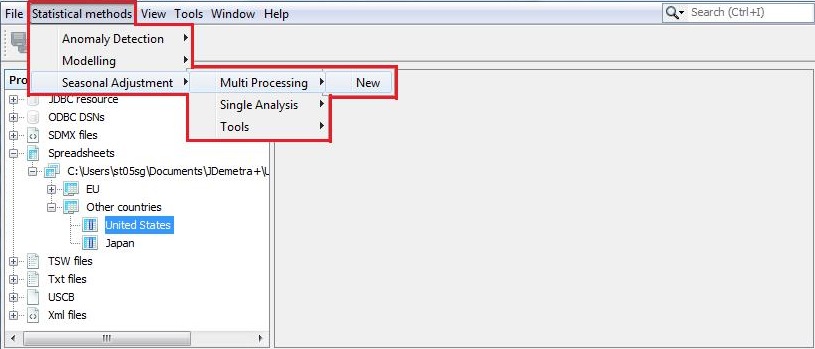
Go to the main menu and follow the path: Statistical methods → Seasonal adjustment → Multi Processing → New to open a multi-document.
Launching the seasonal adjustment for a datasets with multiple time series
-
JDemetra+ opens an empty window (default name: SAProcessing-1). By default, one of the pre-defined specifications will be used for the seasonal adjustment of the dataset. To change the specification used for an adjustment in the current document, click on the button marked in the picture below. This will provide you with the alternative methods of adjustment.
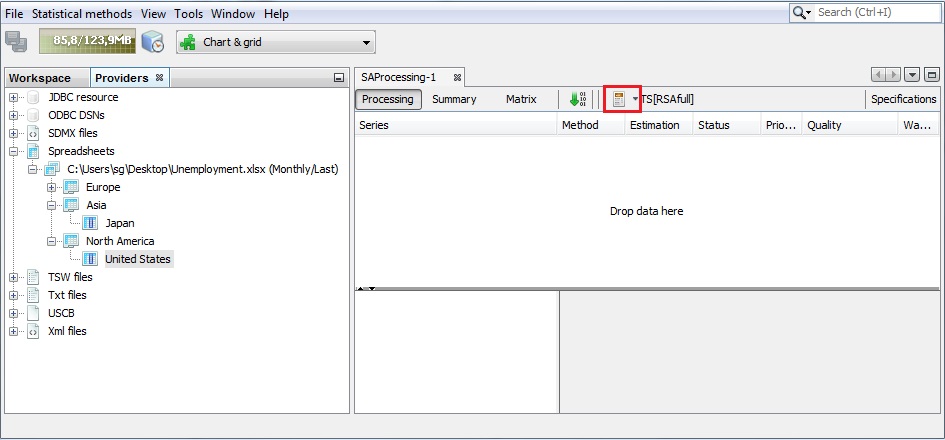
Default window for seasonal adjustment process of the dataset
-
The list available from the SAProcessing window includes the pre-defined specifications and the user-defined specifications (if any). Click on the specification that will be used for the seasonal adjustment (in the example below RSA4 is selected).
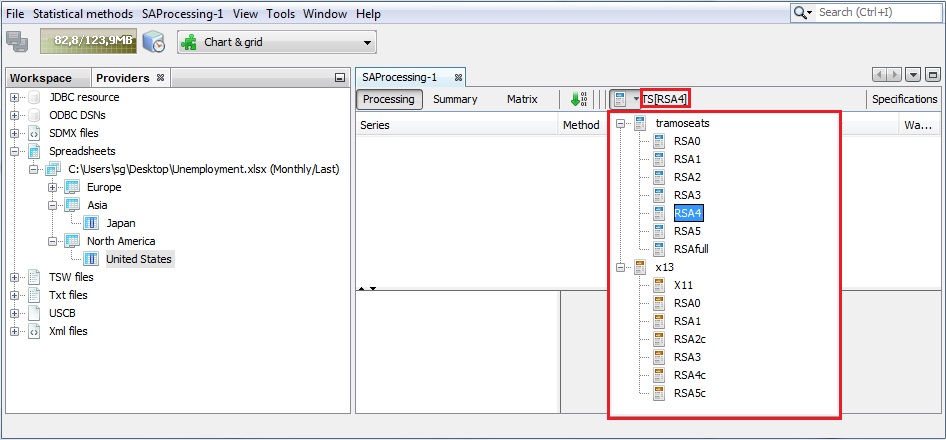
Choice of the specification
-
Drag and drop series from the Providers window to the SAProcessing window. You can drag and drop individual series or an entire dataset (i.e. a set of series that have been imported together, e.g. series from the same Excel file). It is possible to drag and drop the same series several times. It allows the user to apply different specifications to the same time series in order to compare the results. The series visible in the SAProcessing window are not seasonally adjusted yet (Status – "Unprocessed"). The adjustment will be performed using RSA4 specification. For a newly created SAProcessing window the Estimation column is always set to Concurrent, which means that previous results for these time series will not be taken into account once this seasonal adjustment is launched (as they do not exist). However, a seasonal adjustment processing window may be saved and re-launched in the next session of JDemetra+. Then the user can decide if and how the previous results will be taken into account in the current session. At this stage the Priority, Quality and Warnings columns are empty as seasonal adjustment has not yet been performed.
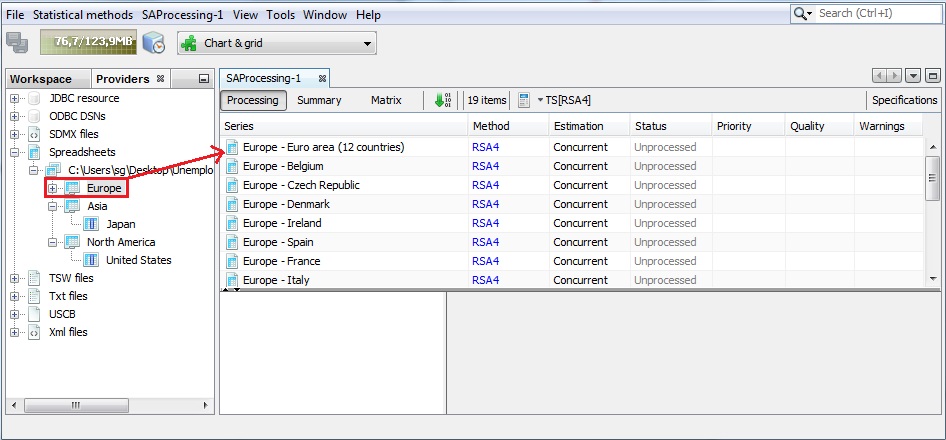
Adding the series to the multi document
-
Once the user clicks on the start button (the button with a green arrow) the time series are processed, the statuses are updated and some information about the quality of the adjustments and possible problems are displayed in the Warnings column as exclamation marks.
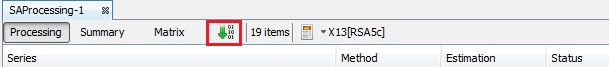
The Start button
-
Generally, the warnings are put forward for short series, non-decomposable models (SEATS) or when the differenced series do not show seasonal peaks. Information on the warnings is displayed when the cursor hovers over an exclamation mark.
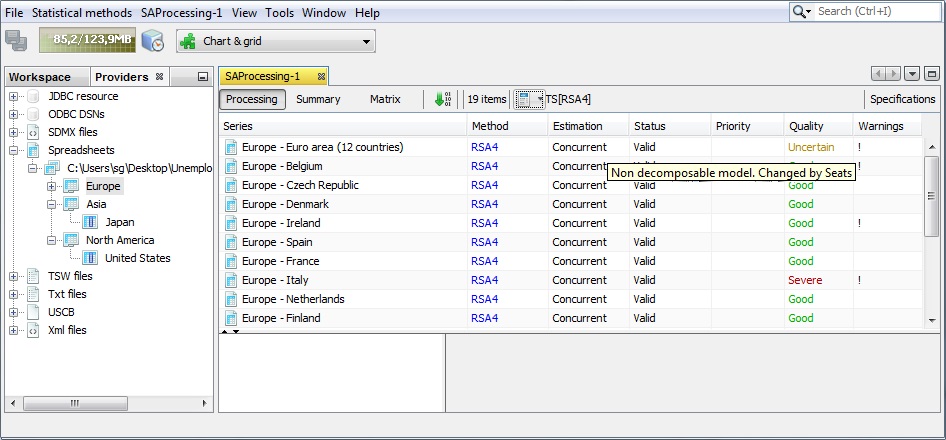
The results of a seasonal adjustment process
-
When the user clicks on an individual time series in the SAProcessing window, detailed results are displayed in the panel below the list of the series. By default, a summary of results is displayed, accompanied by two graphs: an overlay graph on the left with the original data, seasonally-adjusted series and the trend-cycle and the SI ratio graph on the right. These diagnostics and graphs are discussed here.
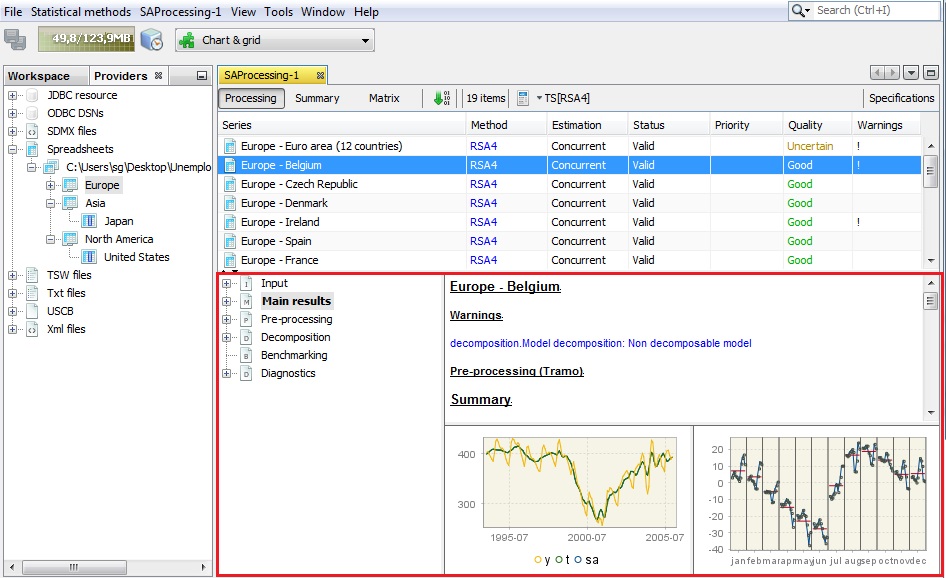
The inspection of the seasonal adjustment results for a chosen time series
-
The Main results panel provides information on the quality of the adjustment. Study the diagnostic section using the vertical scrollbar. The results are marked in green, yellow or red, depending on the result of a statistical test used. Those in green indicate that no problematic characteristic have been detected (e.g. lack of normality of residuals, autocorrelation in residuals). Yellow indicates that the test outcome is uncertain. The outcomes in red highlight cases where an issue should be addressed. Hence, test statistics will indicate the need (if any) to improve the model. Ideally, the model should be improved so that no test statistics indicate uncertainties in the results.
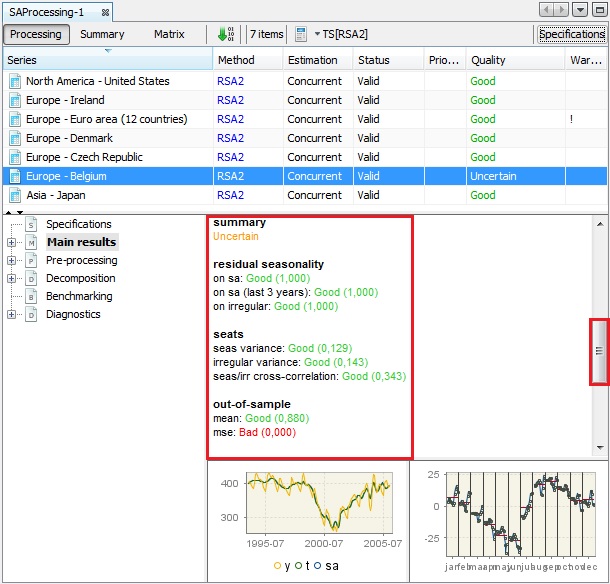
The diagnostics results – simple seasonal adjustment of a multiple time series
-
To explore the results, expand the tree on the left and click on the desired node. Here the out-of-sample test was chosen.
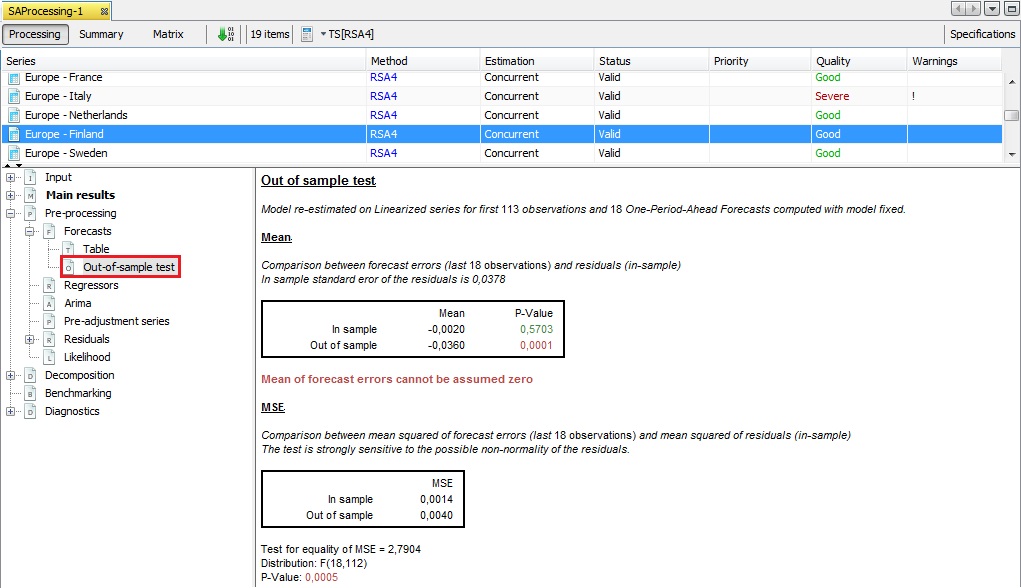
Out-of-sample test results
-
The specifications used for a seasonal adjustment of an individual series can be changed by clicking on the Specifications button as described here.
-
To export the output for a whole dataset, select the Output item from the SAProcessing menu.
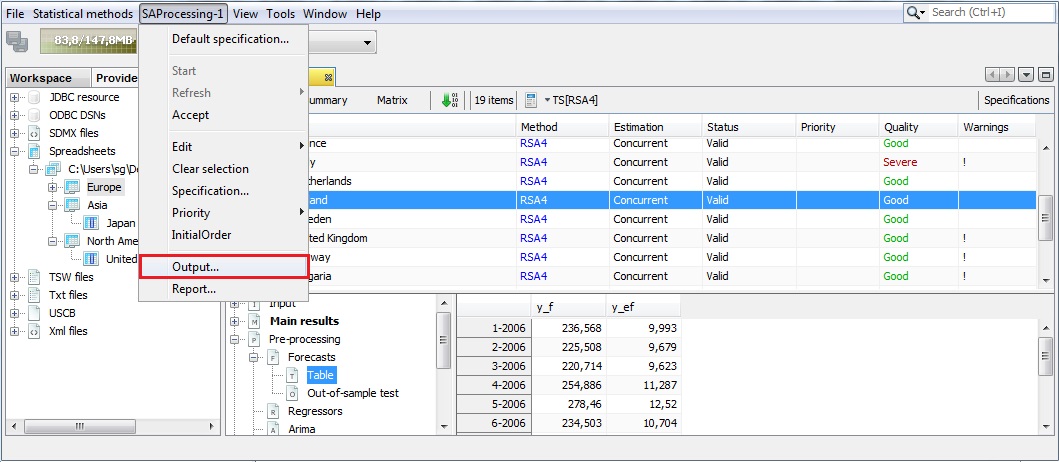
The SAProcessing menu
-
Expand the "+" menu and choose an appropriate data format (here Excel has been chosen). It is possible to save the results in TXT, XLS, CSV, and CSV matrix formats. Note that the available content of the output depends on the output type.
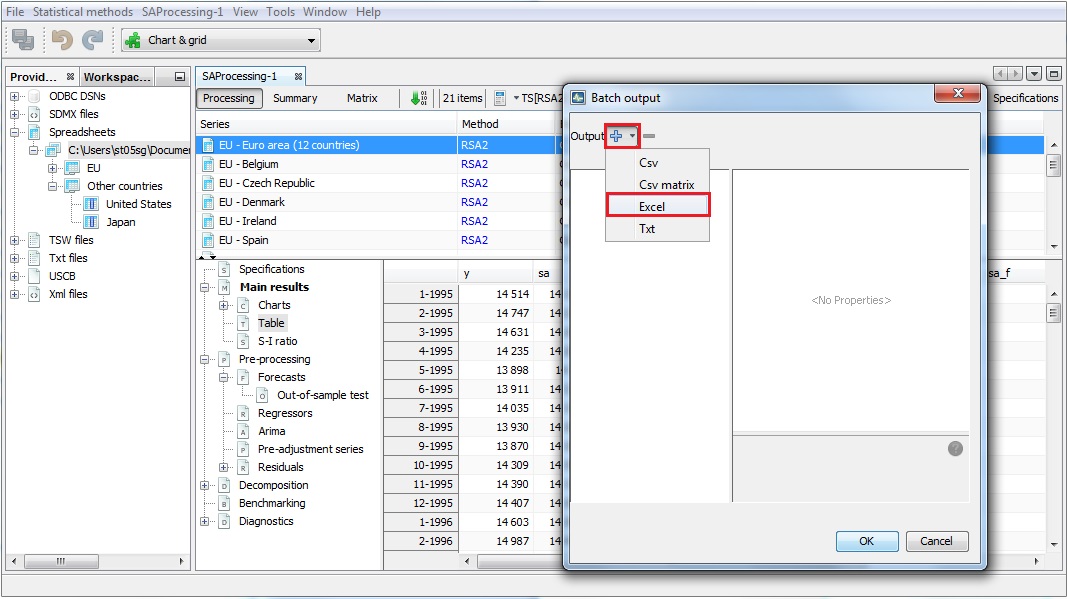
Exporting data to an Excel file
-
Specify export details and click OK.
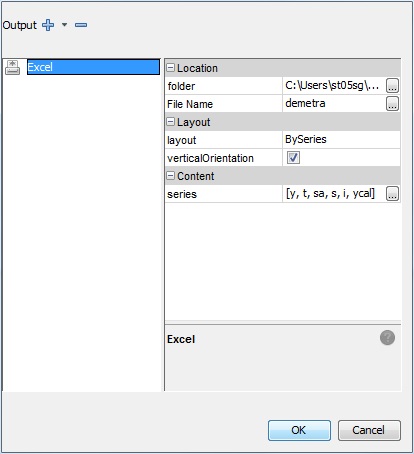
Defining the export details
-
To save the workspace that includes the results in the processing window (named SAProcessing-1 in the example) select Save Workspace As… item from the File menu.
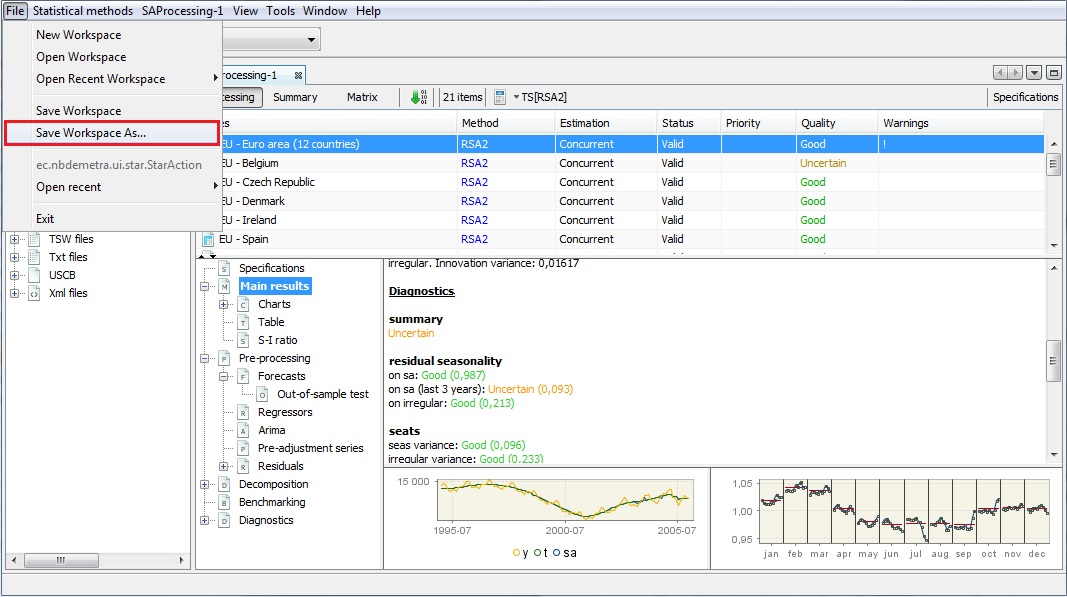
Saving the workspace
-
Enter the location and the workspace name and click Save.
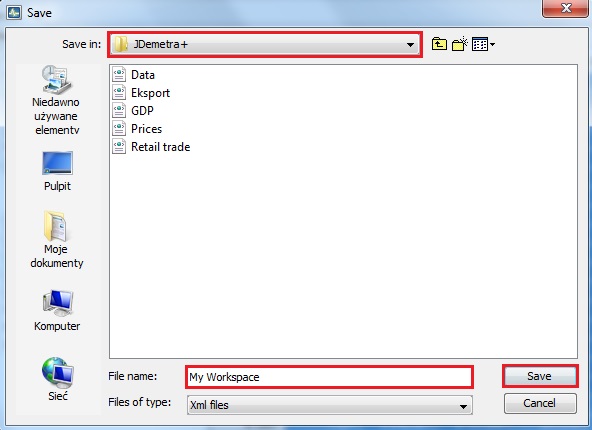
Saving details
-
The document is visible in the Workspace window under the multi-documents branch.
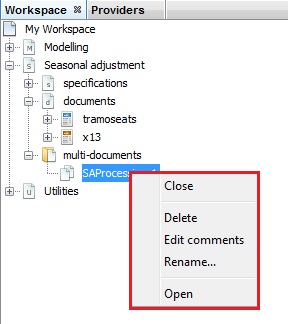
The content of the context menu for a multi-document
-
The document can be opened, deleted or renamed from the context menu. The user can also add comments to the document. When JDemetra+ is launched again the saved workspace can be opened and the multi-document can be run again.
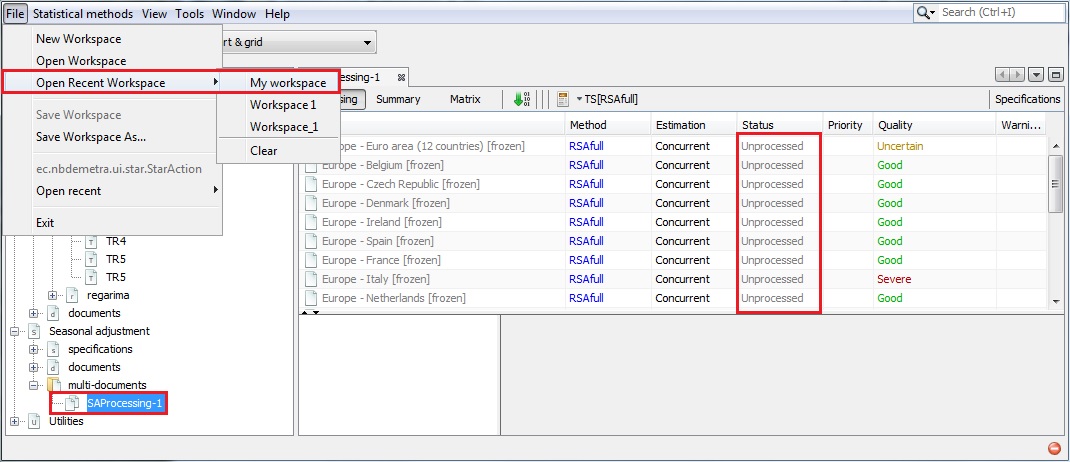
Reopening the multi-document
-
The seasonal adjustment can be refreshed by clicking on the green arrow button or by choosing the refresh option from SAProcessing menu (note that the name of this main menu item corresponds to the name of the processing window).
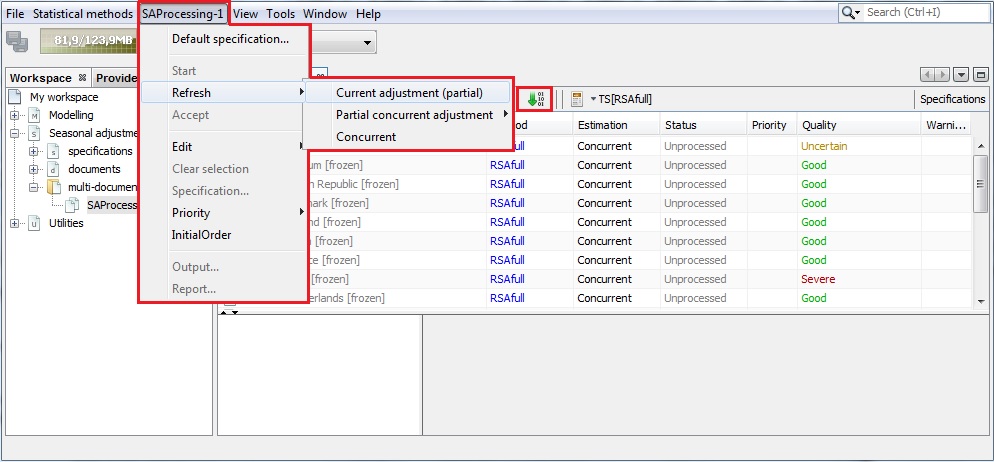
Refreshing option