Output options
-
Once a seasonal adjustment process for the dataset is performed (see the Simple seasonal adjustment of a single time series scenario) the results can be exported to the external file. Go to the main menu and follow the path: SAProcessing → Output…
-
In the Batch output window the user can specify which output items will be saved and the folder in which JDemetra+ saves the results. It is possible to save the results in the TXT, XLS, CSV, and CSV matrix formats. In the first step the user should choose the output format from the list.
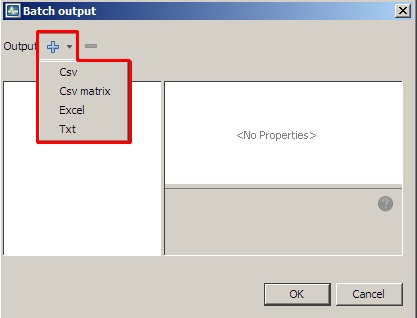
Default output formats
-
The user may choose more than one format as the output can be generated in different formats at the same time.
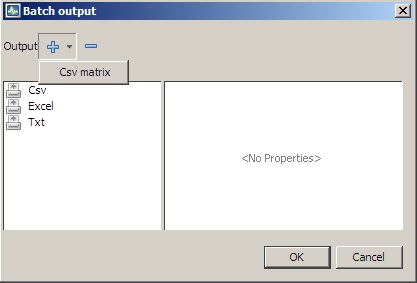
Adding an output format to the list
-
To display and modify the settings click on the given output format on the list. The available options depend on the output format.
-
For Csv format the following options are available: folder (location of the file), file prefix (name of the file), presentation (controls how the output is divided into separate files) and series (series included in the file). These options are presented in the next points of this case study.
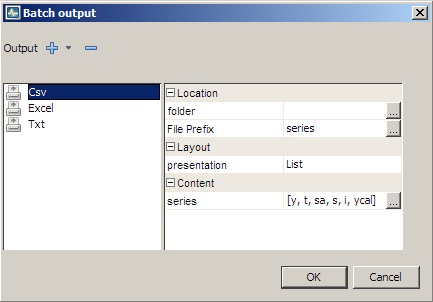
Options for a Csv format
-
The user can define the folder in which the selected results and components will be saved (click the folder item and choose the final destination).
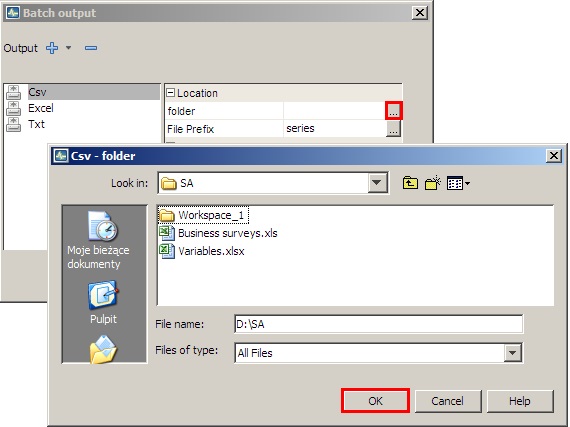
Specifying a destination folder
-
With the option File Prefix the user can modify the default name of the output saved in the CSV file.
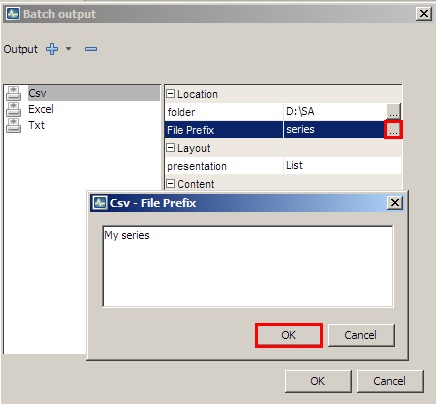
Setting a File Prefix option
-
Layout controls how the output is divided into separate files. Expand the list to display available options:
-
HTable – the output series will be presented in the form of horizontal tables (time series in rows).
-
VTable – the output series will be presented in the form of vertical tables (time series in columns).
-
List – the output series will be presented in the form of vertical tables (time series in rows). Apart from that, for each time series each file contains in separate columns: the data frequency, the first year and of estimation span, the first period (month or quarter) of observation span and the number of observations. The files do not include dates.
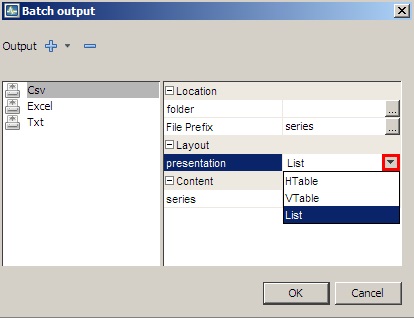
Layout options for a Csv format
-
-
The Content section presents a list of series that will be included into a set of output files. To modify the initial settings click on the grey button in the Content section. The CVS-series window presents two panels: the panel on the left includes a list of all valuable output items. The panel on the right presents the selected output items. Mark the series and use the arrows to change the settings. Confirm your choice with the OK button.
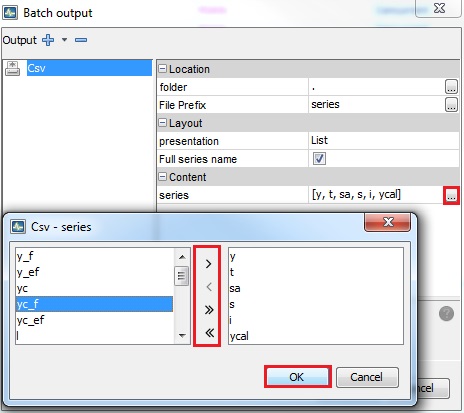
Specifying a content of the output file
-
Options available for the XLS format are the same as for the TXT format with an exception of the Layout section. The list of available codes in the Content section is given here.
-
BySeries – all results for a given time series are placed in one sheet;
-
ByComponent – results are grouped by components. Each component type is saved in a separate sheet.
-
OneSheet – all results are saved in one sheet.
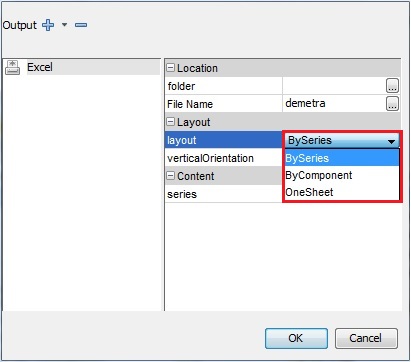
Layout options for an Excel format
-
-
If the user sets the option layout to ByComponent, the output will be generated as follows:
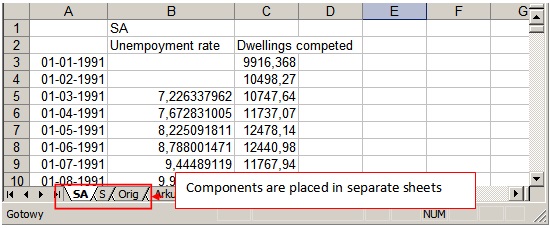
An Excel file view for the ByComponent option
-
The option OneSheet will produce the following XLS file:
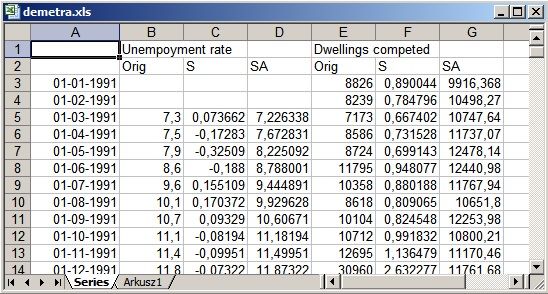
An Excel file view for the OneSheet option
-
By default, the series in the Excel output files are organised vertically. When the user unmarks the check box the horizontal orientation is used.
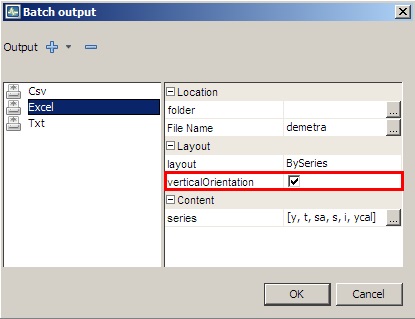
The VerticalOrientation option
-
In the case of the TXT format the only available options are folder (location of the file) and series (results included in the output file). The list of available codes in the Content section is given here.
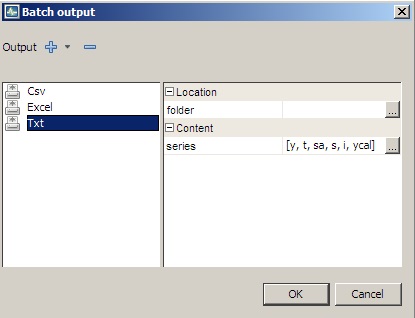
Options for the Txt output
-
The CSV matrix produces the CSV file containing information about the model and quality diagnostics of the seasonal adjustment. The user may generate the list of default items or create their own quality report. By default, all the available items are included in the output. The list of the items is given here.
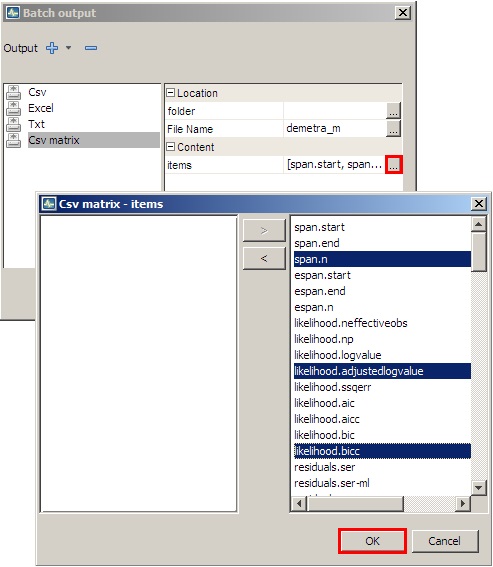
List of items available for the Csv matrix output type
-
Once the output settings are selected, click the OK button.
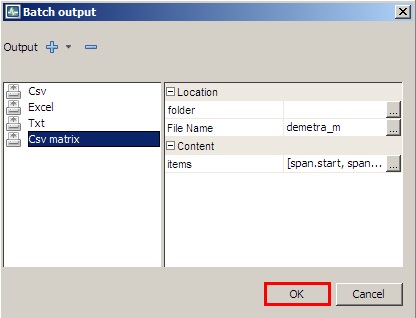
Options for the Csv matrix output
-
For each output JDemetra+ provides information on the status of the operation. An example is presented below.
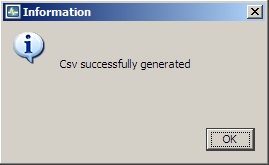
Generating output - status information