Identification of seasonal peaks in a Tukey periodogram and in an autoregressive spectrum
In order to decide whether a series has a seasonal component that is predictable (stable) enough, these tests use visual criteria and formal tests for the periodogram. The periodogram is calculated using complete years, so that the set of Fourier frequencies contains exactly all seasonal frequencies1.
The tests rely on two basic principles:
-
The peaks associated with seasonal frequencies should be larger than the median spectrum for all frequencies and;
-
The peaks should exceed the spectrum of the two adjacent values by more than a critical value.
JDemetra+ performs this test on the original series. If these two requirements are met, the test results are displayed in green. The statistical significance of each of the seasonal peaks (i.e. frequencies $\frac{\pi}{6},\ \frac{\pi}{3},\ \frac{\pi}{2},\ \frac{2\pi}{3}$ and $\frac{5\pi}{6}$ corresponding to 1, 2, 3, 4 and 5 cycles per year) is also displayed. The seasonal and trading days frequencies depends on the frequency of time series. They are shown in the table below. The symbol $d$ denotes a default frequency and is described below the table.
The seasonal and trading day frequencies by time series frequency
| Number of months per full period | Seasonal frequency | Trading day frequency (radians) |
|---|---|---|
| 12 | $\frac{\pi}{6},\frac{\pi}{3},\ \frac{\pi}{2},\frac{2\pi}{3},\ \frac{5\pi}{6},\ \pi$ | $d$, 2.714 |
| 6 | $\frac{\pi}{3},\frac{2\pi}{3}$, $\pi$ | \(d\) |
| 4 | $\frac{\pi}{2}$, $\pi$ | $d$, 1.292, 1.850, 2.128 |
| 3 | \(\pi\) | \(d\) |
| 2 | \(\pi\) | \(d\) |
The calendar (trading day or working day) effects, related to the variation in the number of different days of the week per period, can induce periodic patterns in the data that can be similar to those resulting from pure seasonal effects. From the theoretical point of view, trading day variability is mainly due to the fact that the average number of days in the months or quarters is not equal to a multiple of 7 (the average number of days of a month in the year of 365.25 days is equal to $\frac{365.25}{12} =$ 30.4375 days). This effect occurs $\frac{365.25}{12} \times \frac{1}{7} =$ 4.3482 times per month: one time for each one of the four complete weeks of each month, and a residual of 0.3482 cycles per month, i.e. $0.3482 \times 2\pi = 2.1878$ radians. This turns out to be a fundamental frequency for the effects associated with monthly data. In JDemetra+ the fundamental frequency corresponding to 0.3482 cycles per month is used in place of the closest frequency $\frac{\text{πk}}{60}$. Thus, the quantity $\frac{\pi \times 42}{60}$ is replaced by $\omega_{42} = 0.3482 \times 2\pi = 2.1878$. The frequencies neighbouring $\omega_{42}$, i.e. $\omega_{41}$ and $\omega_{43}$ are set to, respectively, $2.1865 - \frac{1}{60}$ and $2.1865 + \frac{1}{60}$.
The default frequencies ($d)\ $for calendar effect are: 2.188 (monthly series) and 0.280 (quarterly series). They are computed as:
\(\omega_{\text{ce}} = \frac{2\pi}{7}\left( n - 7 \times \left\lbrack \frac{n}{7} \right\rbrack \right)\), [1]
where:
$n = \frac{365.25}{s}$, $s = 4$ for quarterly series and $s = 12$ for monthly series.
Other frequencies that correspond to trading day frequencies are: 2.714 (monthly series) and 1.292, 1.850, 2.128 (quarterly series).
In particular, the calendar frequency in monthly data (marked in red on the figure below) is very close to the seasonal frequency corresponding to 4 cycles per year $\text{ω}_{40} = \frac{2}{3}\pi = 2.0944$.
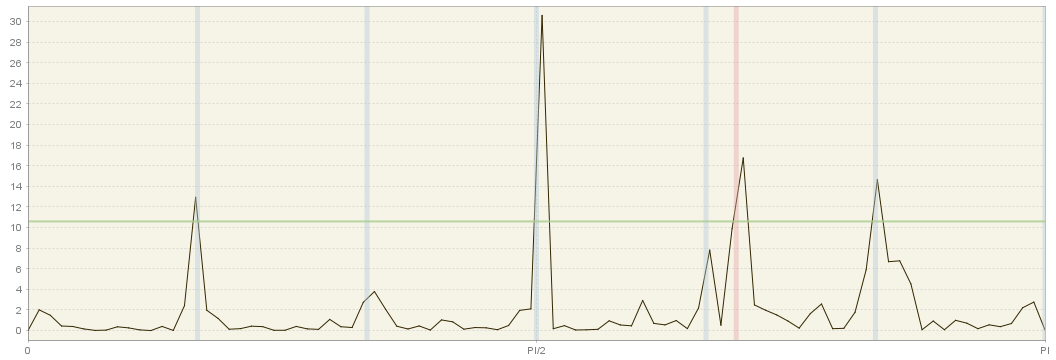
Periodogram with seasonal (grey) and calendar (red) frequencies highlighted
This implies that it may be hard to disentangle both effects using the frequency domain techniques.
-
For definition of the periodogram and Fourier frequencies see section Spectral Analysis ↩