Test on autocorrelation at seasonal lags
Overview
The QS test is a variant of the Ljung-Box test computed on seasonal lags, where we only consider positive auto-correlations
More exactly,
\[QS=n \left(n+2\right)\sum_{i=1}^k\frac{\left[ \max \left(0, \hat\gamma_{i \cdot l}\right)\right]^2}{n-i \cdot l}\]where \(k=2\), so only the first and second seasonal lags are considered. Thus, the test would checks the correlation between the actual observation and the observations lagged by one and two years. Note that \(l=12\) when dealing with monthly observations, so we consider the autocovariances \(\hat\gamma_{12}\) and \(\hat\gamma_{24}\) alone. In turn, \(k=4\) in the case of quarterly data.
Under H0, which states that the data are independently distributed, the statistics follows a \(\chi \left(k\right)\) distribution. However, the elimination of negative correlations makes it a bad approximation. The p-values would be given by $P(\chi^{2}\left( k \right) > Q)$ for $k = 2$. As ${P(\chi}^{2}(2)) > 0.05 = 5.99146$ and ${P(\chi}^{2}(2)) > 0.01 = 9.21034$, $QS > 5.99146$ and $QS > 9.21034$ would suggest rejecting the null hypothesis at $95\%$ and $99\%$ significance levels, respecively.
Modification
Maravall (2012) proposes approximate the correct distribution (p-values) of the QS statistic using simulation techniques. Using 1000K replications of sample size 240, the correct critical values would be 3.83 and 7.09 with confidence levels of $95\%$ and $99\%$, respectively (lower than the 5.99146 and 9.21034 shown above). For each of the simulated series, he obtains the distribution by assuming $QS=0$ when \(\hat\gamma_{12}\), so in practice this test will detect seasonality only when any of these conditions hold:
- Statistically significant positive autocorrelation at lag 12
- Nonnegative sample autocorrelation at lag 12 and statistically significant positive autocorrelation at lag 24
Use
The test can be applied directly to any series by selecting the option Statistical Methods » Seasonal Adjustment » Tools » Seasonality Tests. This is an example of how results are displayed for the case of a monthly series:
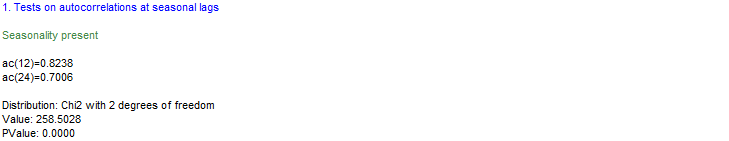
The test can be applied to the input series before any seasonal adjustment method has been applied. It can also be applied to the seasonally adjusted series or to the irreguar component.
Implementation
This test is implemented in the class ec.satoolkit.diagnostics.QsTest
References
- LJUNG G. M. and G. E. P. BOX (1978). “On a Measure of a Lack of Fit in Time Series Models”. Biometrika 65 (2): 297–303. doi:10.1093/biomet/65.2.297
- MARAVALL, A. (2011). ”Seasonality Tests and Automatic Model Identification in Tramo-Seats”. Manuscript
- MARAVALL, A. (2012). “Update of Seasonality Tests and Automatic Model Identification in TRAMO-SEATS”. Bank of Spain (November 2012)