Autocorrelation function
The correlation is a measure of the strength and the direction of a linear relationship between two variables. For time series the correlation can refer to the relation between its observations, e.g. between the current observation and the observation lagged by a given number of units. In this case all observations come from one variable, so similarity between a given time series and a $k$-lagged version of itself over successive time intervals is called an autocorrelation.
The autocorrelation coefficient at lag $k$ is defined as:
\(\rho\left( k \right) = \frac{\sum_{t = k + 1}^{n}\left( x_{t} - \overline{x} \right)}{\sum_{t = 1}^{n}\left( x_{t} - \overline{x} \right)^{2}}\), [1]
where:
$x_{t}$ – time series;
$n$ – total number of observations;
$\overline{x}$ – mean of the time series.
The set of autocorrelation coefficients $(k)$ arranged as a function of $k$ is the autocorrelation function (ACF). The graphical or numerical representation of the ACF is called an autocorrelogram.
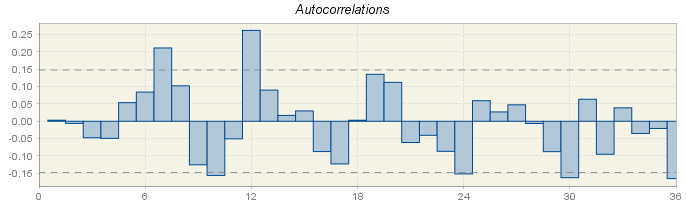
Autocorrelation function
The autocorrelation function is a valuable tool for investigating properties of an empirical time series.1 The assessment of the order of an AR process simply from the sample ACF is not straightforward. While for a first-order process the theoretical ACF decreases exponentially and the sample function is expected to have the similar shape, for the higher-order processes the ACF maybe a mixture of damper exponential or sinusoidal functions, which makes the order of the AR process difficult to identify.2 JDemetra+ displays the values of autocorrelation function for the residuals from the ARIMA model (see section Residuals). The ACF graph (figure above), presents autocorrelation coefficients and the confidence intervals. If the autocorrelation coefficient is in the confidence interval, it is regarded as not statistically significant. Therefore, the user should focus on the values where the value of the ACF is outside the confidence interval. In JDemetra+ the confidence interval is indicated by two grey, horizontal, dotted lines.
Partial autocorrelation function
The partial autocorrelation is a tool for the identification and estimation of the ARIMA model. It is defined as the amount of correlation between two variables that is not explained by their mutual correlations with a given set of other variables.
Partial autocorrelation at lag $k$ is defined as the autocorrelation between $x_{t}$ and $x_{t - k}$ that is not accounted for by lags 1 through to $k$-1, which means that correlations with all the elements up to lag $k$ are removed. Following this definition, a partial autocorrelation for lag 1 is equivalent to an autocorrelation.
The partial autocorrelation function (PACF) is the set of partial autocorrelation coefficients $(k)$ arranged as a function of $k$. This function can be used to detect the presence of an autoregressive process in time series and identify the order of this process. Theoretically, the number of significant lags determines the order of the autoregressive process.
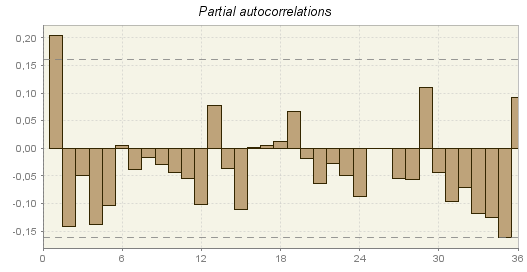
Partial autocorrelation function
The PACF graph above, which is available from the Tools$\ \rightarrow \ $Differencing menu presents partial autocorrelation coefficients and the confidence intervals (two grey, horizontal, dotted lines). If the partial autocorrelation coefficient is in the confidence interval, it is regarded as statistically insignificant. Therefore, the user should focus on the values, for which the absolute value of the PACF is outside the confidence interval.