A demonstration
For a detailed demonstration of the seasonal adjustment process, please refer to the JDemetra+ Tutorial video developed by Andreea Mirica (Statistics Romania). For a step-by-step illustration of the key stages for seasonal adjustment, refer to the guidance below.
The default view of the JDemetra+ window, which is displayed after launching the program, is shown below.
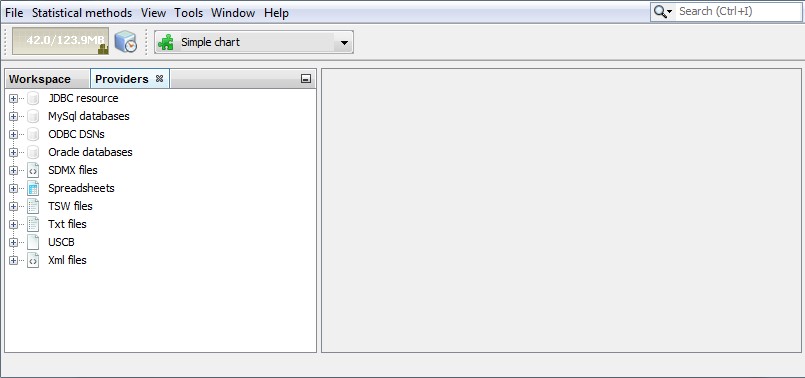
JDemetra+ default window
By default, on the left hand side of the window two panels are visible: the Workspace panel and the Providers panel. The Workspace panel stores the work performed by the user in a coherent and structured way. The Providers panel presents the list of the data sources and organizes the imported series within each data provider.
Importing the series
Once the spreadsheet is prepared as it is shown here and saved, it can be imported to JDemetra+ as it is shown in the video below.
Importing the series
The data are organized in a tree structure. If you expand all the plus-signs under the spreadsheet you will see all the series within each sheet that has been loaded. Here all time series are visible under the Production in construction branch. The names of time series have been taken from the columns’ headings of the spreadsheet while the names of the branches come from sheets’ names.
An automatic seasonal adjustment
To execute a seasonal adjustment process of given time series dataset go to the main menu and follow the path: Statistical methods → Seasonal adjustment → Multi Processing → New. This command opens an empty SAProcessing window. Next, drag and drop series in the SAProcessing window and launch the seasonal adjustment process. Explore the results and save them. The gif below shows the details of the actions performed in an automatic seasonal adjustment process.
An example of an automatic seasonal adjustment process
Manual interventions
The specifications used for seasonal adjustment of an individual series can be changed as shown in the presentation below. Be aware that the changes introduced in a given settings’ section may lead to changes in the output for other parts of the results. The options for the pre-processing of the series are explained under modelling specifications and the options for the pure seasonal adjustment process are explained under seasonal adjustment specifications.
An example of manual interventions to the seasonal adjustment process
Output options
To export the results of seasonal adjustment for the whole dataset, select the Output item from the SAProcessing menu.
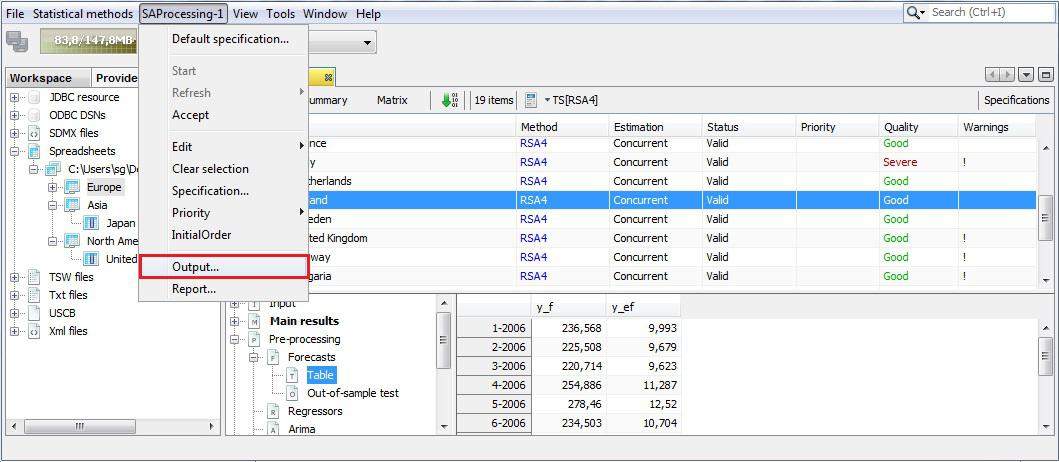
The SAProcessing menu
The procedure to extract the output is explained here in detail. The results can be exported to CSV, CVS matrix, TXT and XLS formats and the list of available items depends on the format choice. The CVS, TXT and XLS formats are used to save the results in a form of the time series. The CVS matrix is a format for saving various diagnostics and statistics. The list of available items is available here.